Purrier Series (Meow) and Making Images Speak
Fourier series can be explained as expressing a repetitive curve as sum of sine curves. Since “summation of sine waves” interpretation shows how many of waves are there at each frequency, it is widely used in engineering, physics, and mathematics. The main idea in this interpretation is that sine and cosine functions are mutually orthogonal, like vectors which are perpendicular to each other.
\(\displaystyle{\frac{1}{\pi}\int \limits_{-\pi}^{\pi} {\color{black}\sin({\color{red}n} x)}{\color{black} \sin({\color{blue}m} x)} dx = \begin{cases} 1, & {\color{red}n} = {\color{blue}m} \\ 0, & {\color{red}n} \neq {\color{blue}m}\end{cases}}\)
\(\displaystyle{\frac{1}{\pi}\int \limits_{-\pi}^{\pi} {\color{black}\cos({\color{red}n} x)}{\color{black} \cos({\color{blue}m} x)} dx = \begin{cases} 1, & {\color{red}n} = {\color{blue}m} \\ 0, & {\color{red}n} \neq {\color{blue}m}\end{cases}}\)
\(\displaystyle{\frac{1}{\pi}\int \limits_{-\pi}^{\pi} {\color{red}\sin({\color{red}n} x)}{\color{blue} \cos({\color{blue}m} x)} dx =0}\)
Reminder; if two unit vectors are orthogonal, result is the same.
\({\bf \hat{{\color{red}e}}}_{\color{red}i} \cdot {\bf \hat{{\color{blue}e}}}_{\color{blue}j} = \begin{cases} 1, & {\color{red}i} ={\color{blue} j} \\ 0,& {\color{red}i} \neq {\color{blue}j} \end{cases}\)
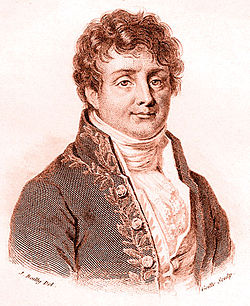
Although it was first discovered by Euler, Fourier realized and demonstrated its importance in analysis of waves; therefore it is known by his name. It is defined as (well, yes it has many forms, but Fourier defined it as):
\(\displaystyle{f(x) = \frac{a_0}{2} + \sum \limits_{n = 1}^N \left[ a_n {\color{red} \sin(n x)} + b_n {\color{blue}\cos(nx)}\right]},\)
\(f(x)\) is a periodic function for \(x \in [-\pi, \pi]\) of which we want to find the representation. \(a_0\) is a constant,
\(a_0 = \displaystyle{\frac{1}{\pi} \int \limits_{-\pi}^{\pi} f(x) dx }\)
\(a_n\) and \(b_n\) defined as:
\(a_n = \displaystyle{\frac{1}{\pi} \int \limits_{-\pi}^{\pi} f(x) {\color{blue} \cos(nx) }dx },\)
\(b_n = \displaystyle{\frac{1}{\pi} \int \limits_{-\pi}^{\pi} f(x) {\color{red}\sin(nx) }dx }.\)
I would like to show Fourier transformations of some functions, because it is basically fun (ᵔᴥᵔ)
Our first function is a signal which is switching between +1 and -1:

Now we are trying to interpret it as a Fourier series. Each sine wave has a certain frequency. We have to find how many of them are there for each frequency. I am writing the resultant Fourier series :
\(f(x) = \displaystyle{ \sum \limits_{n = 1,3,5,7…}^{\infty} \left(\frac{4}{n \pi}\right)\sin\left(\frac{n \pi x}{L}\right)}\)
\(L\), which is the period of \(f(x)\), is \(2\pi\) for this example. In the animations below, I will show the Fourier series for n values of \(n = 1,3,5,7,9,11,13,15\).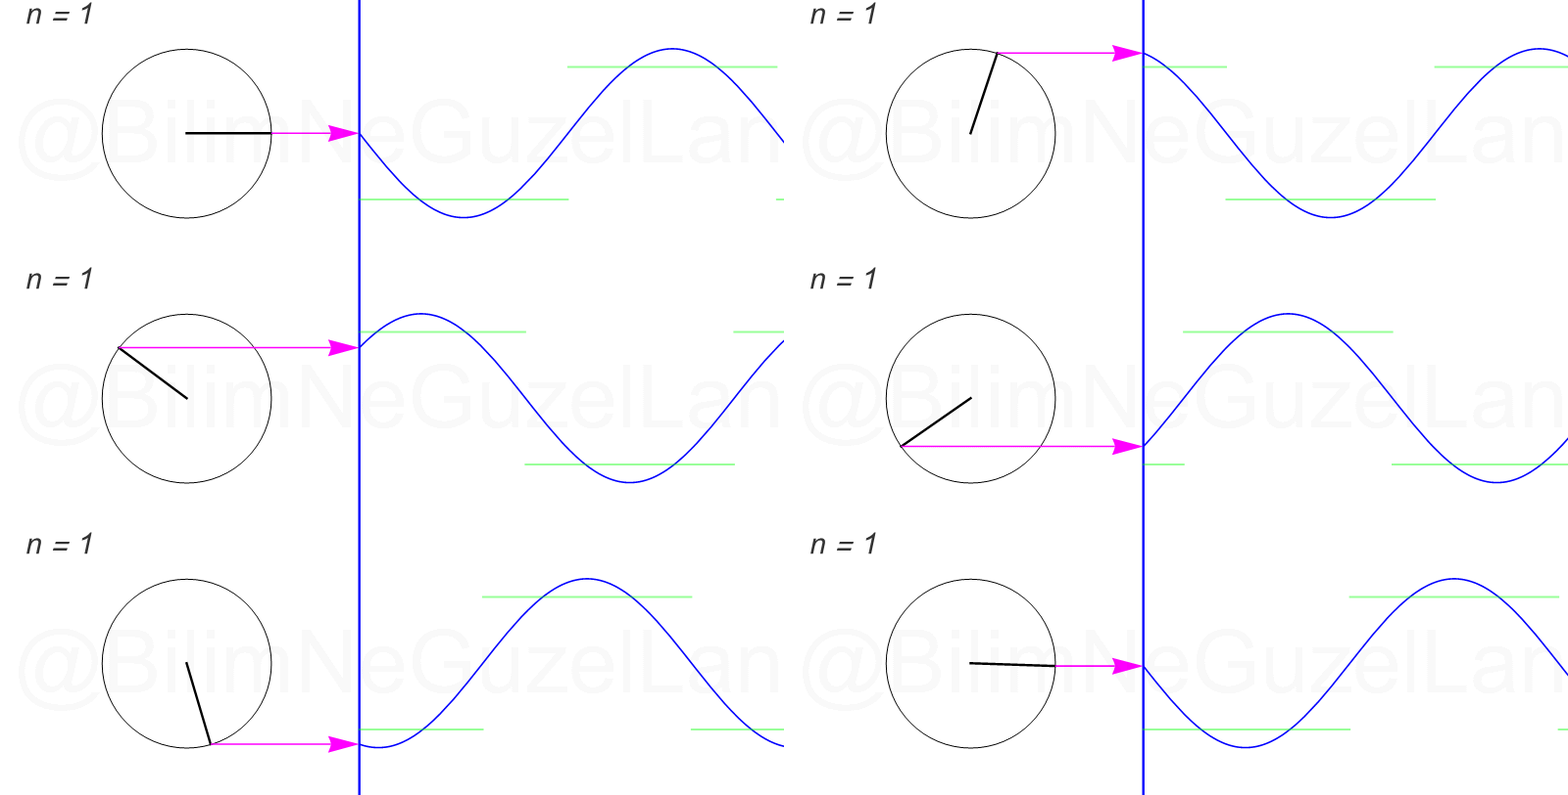
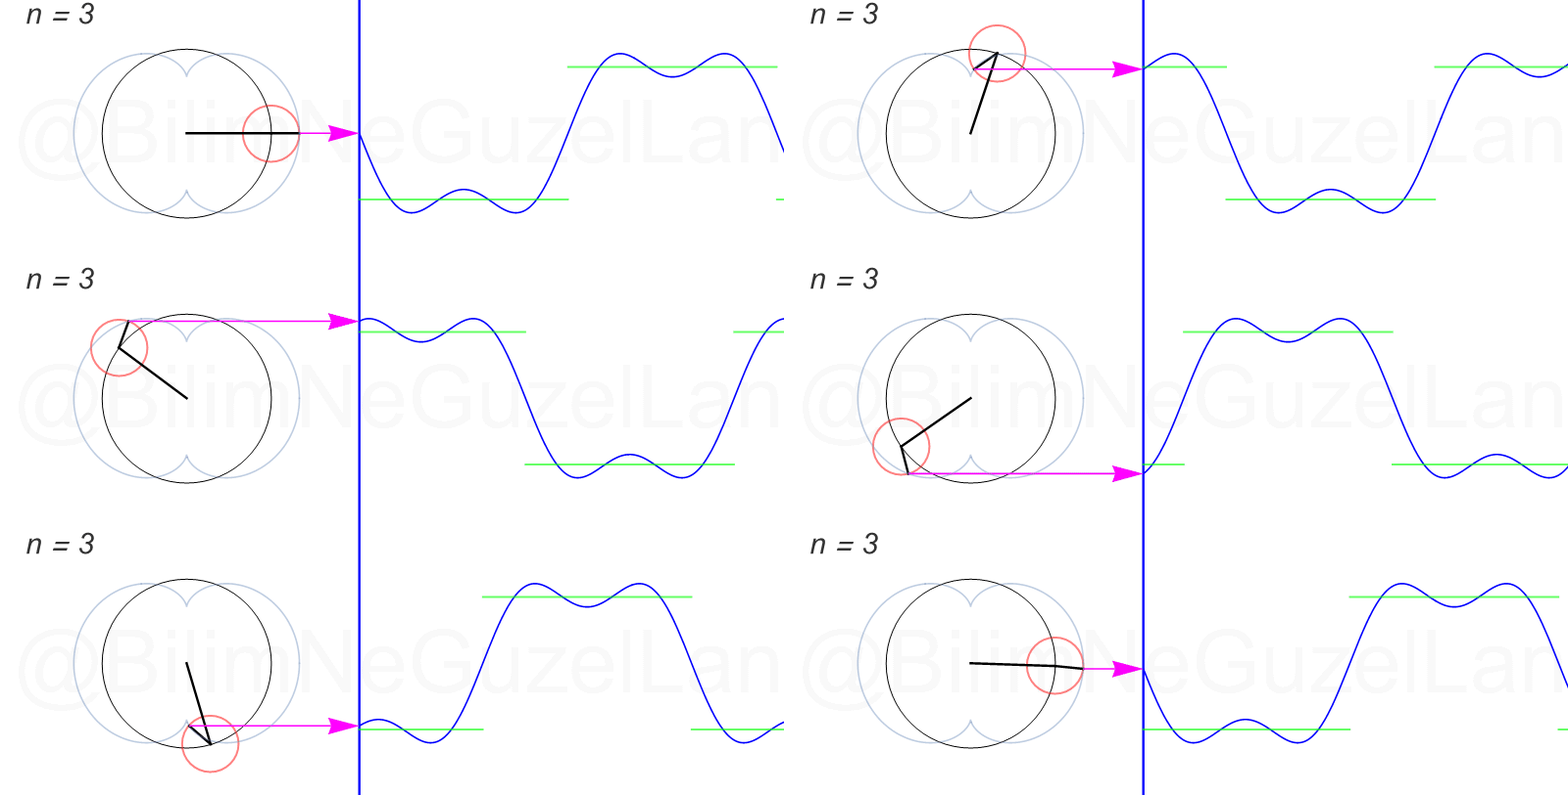
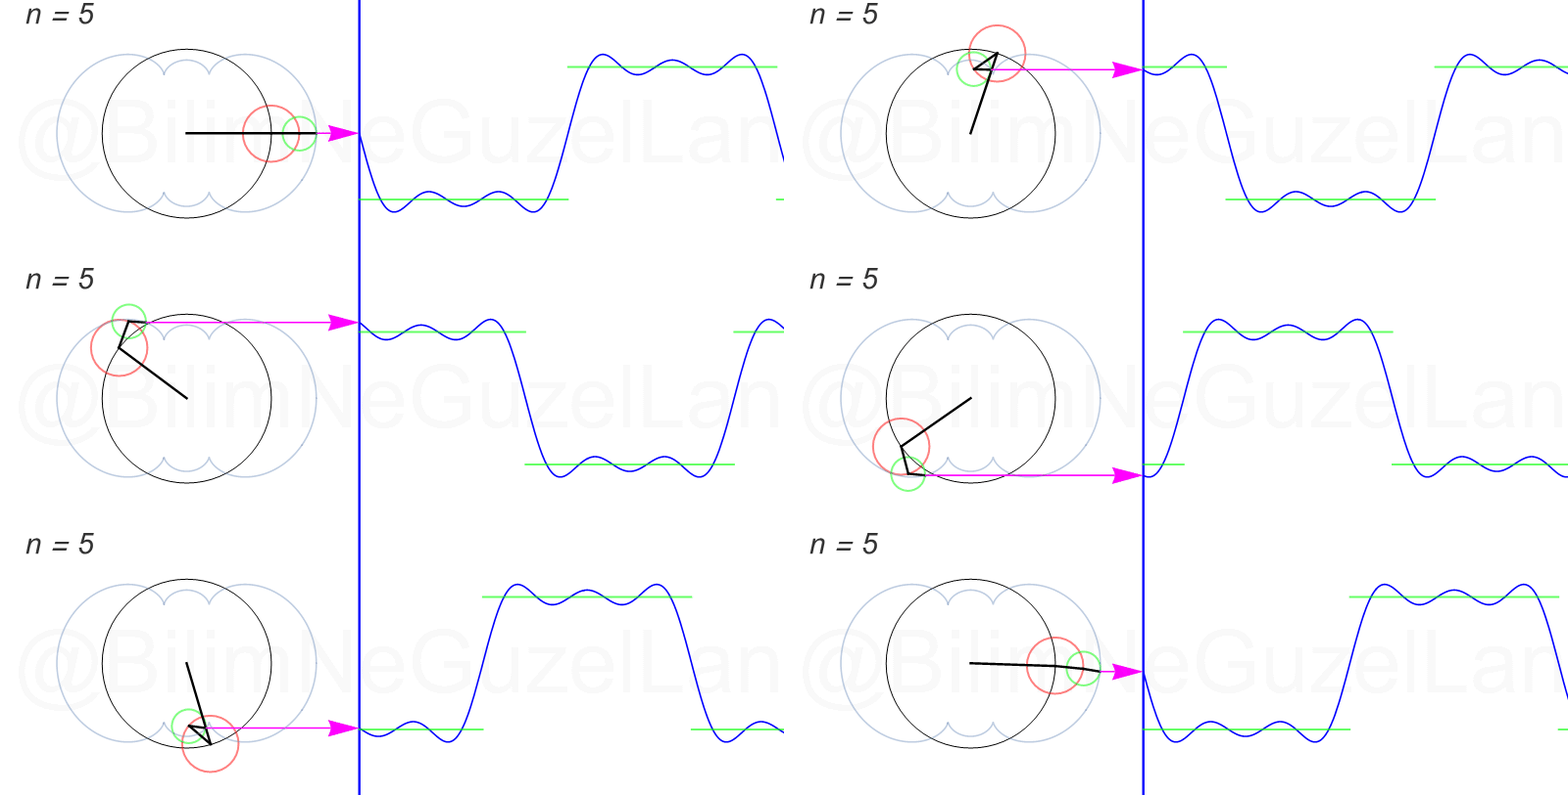
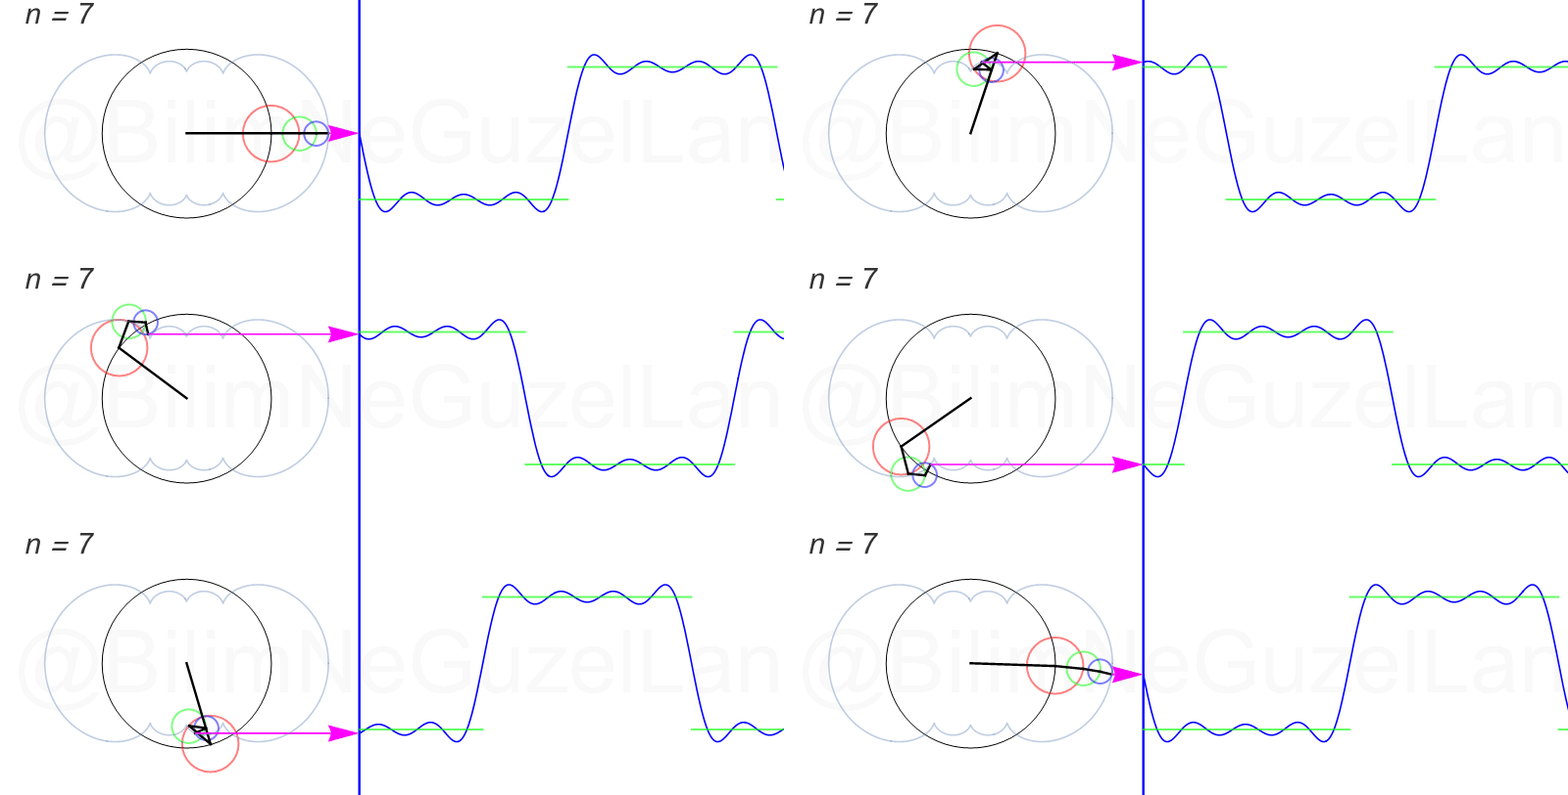
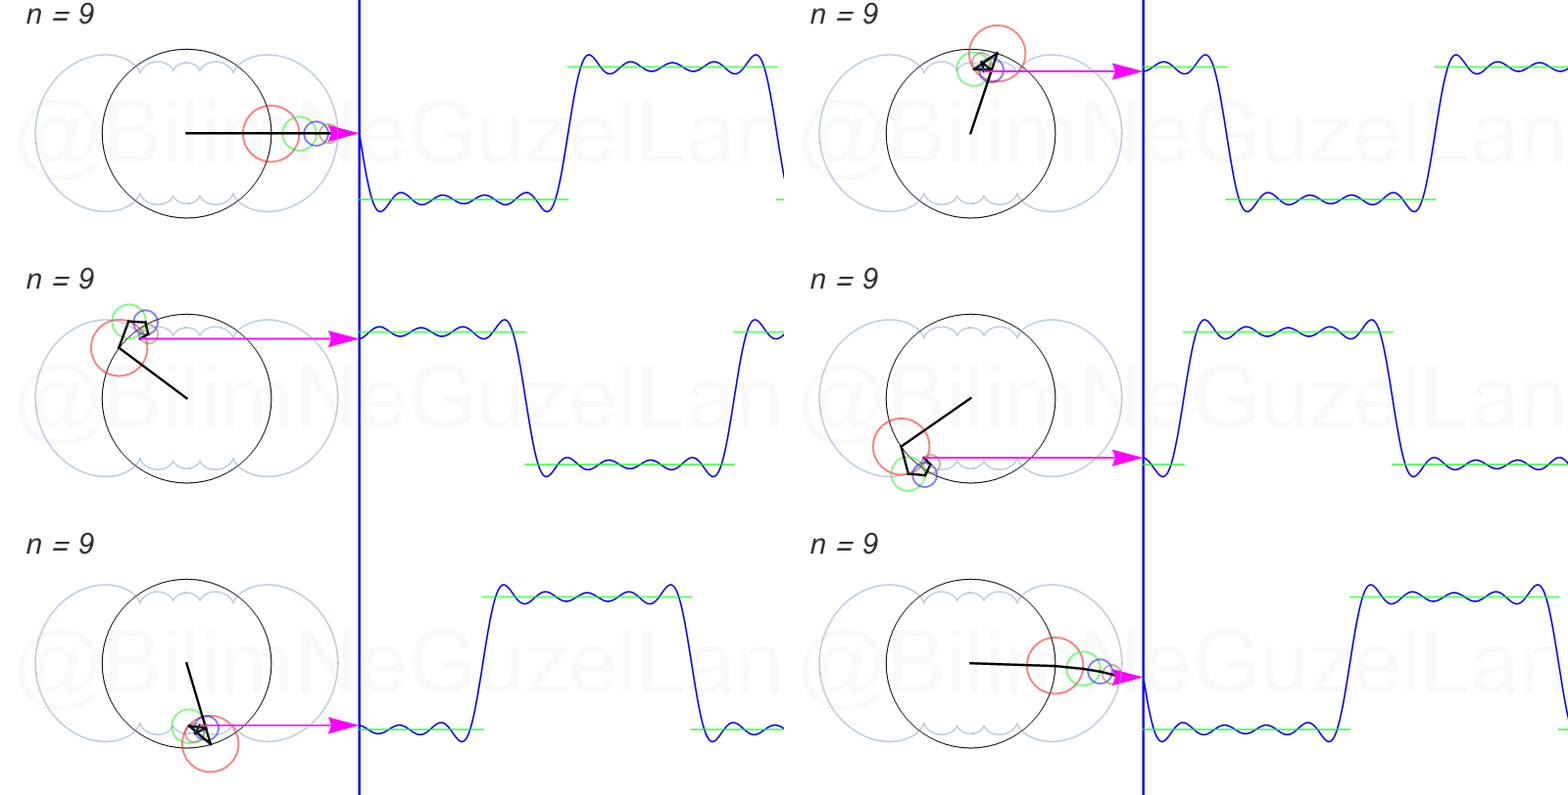
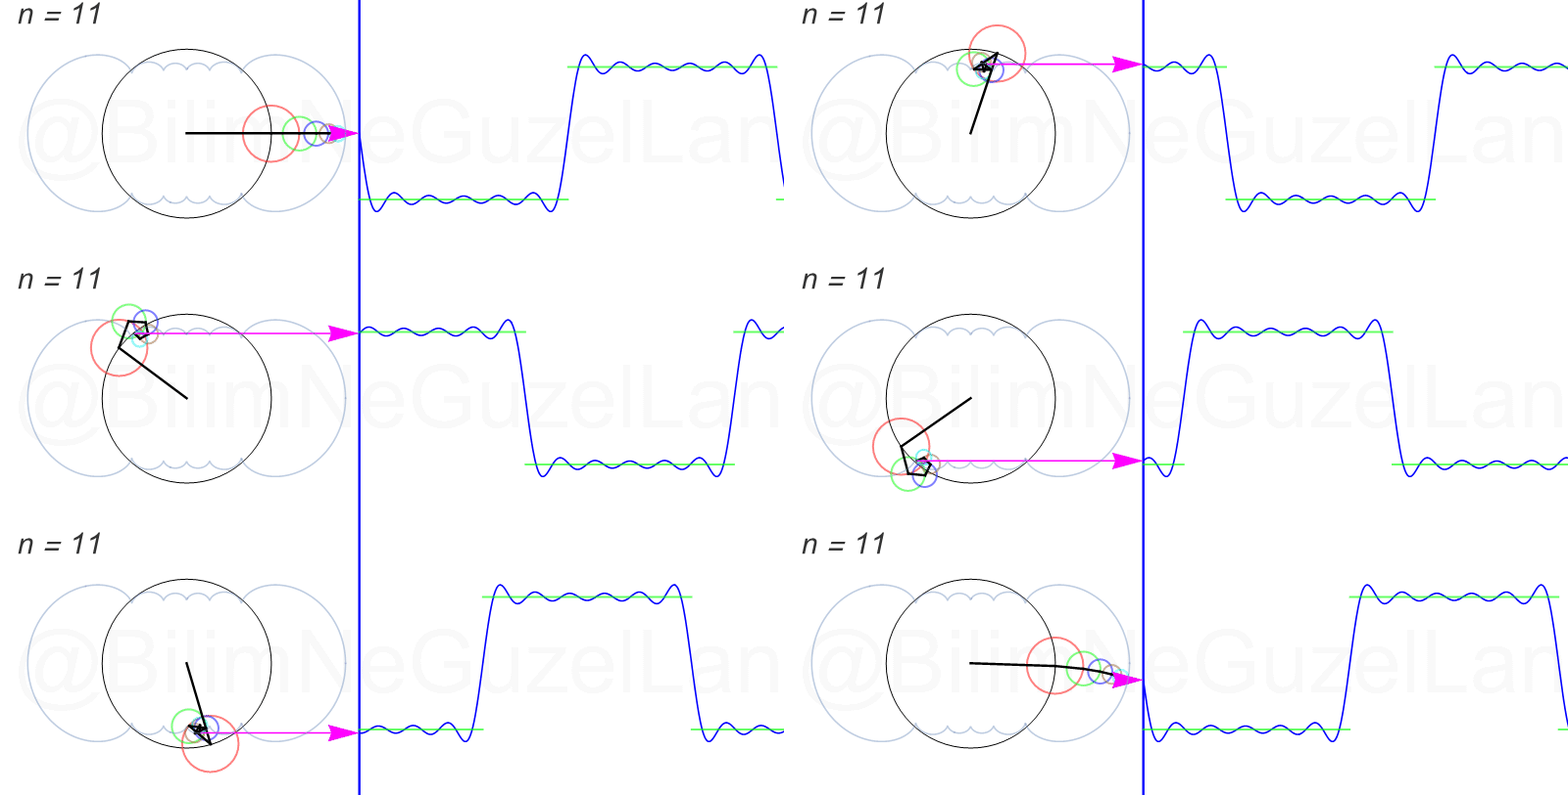
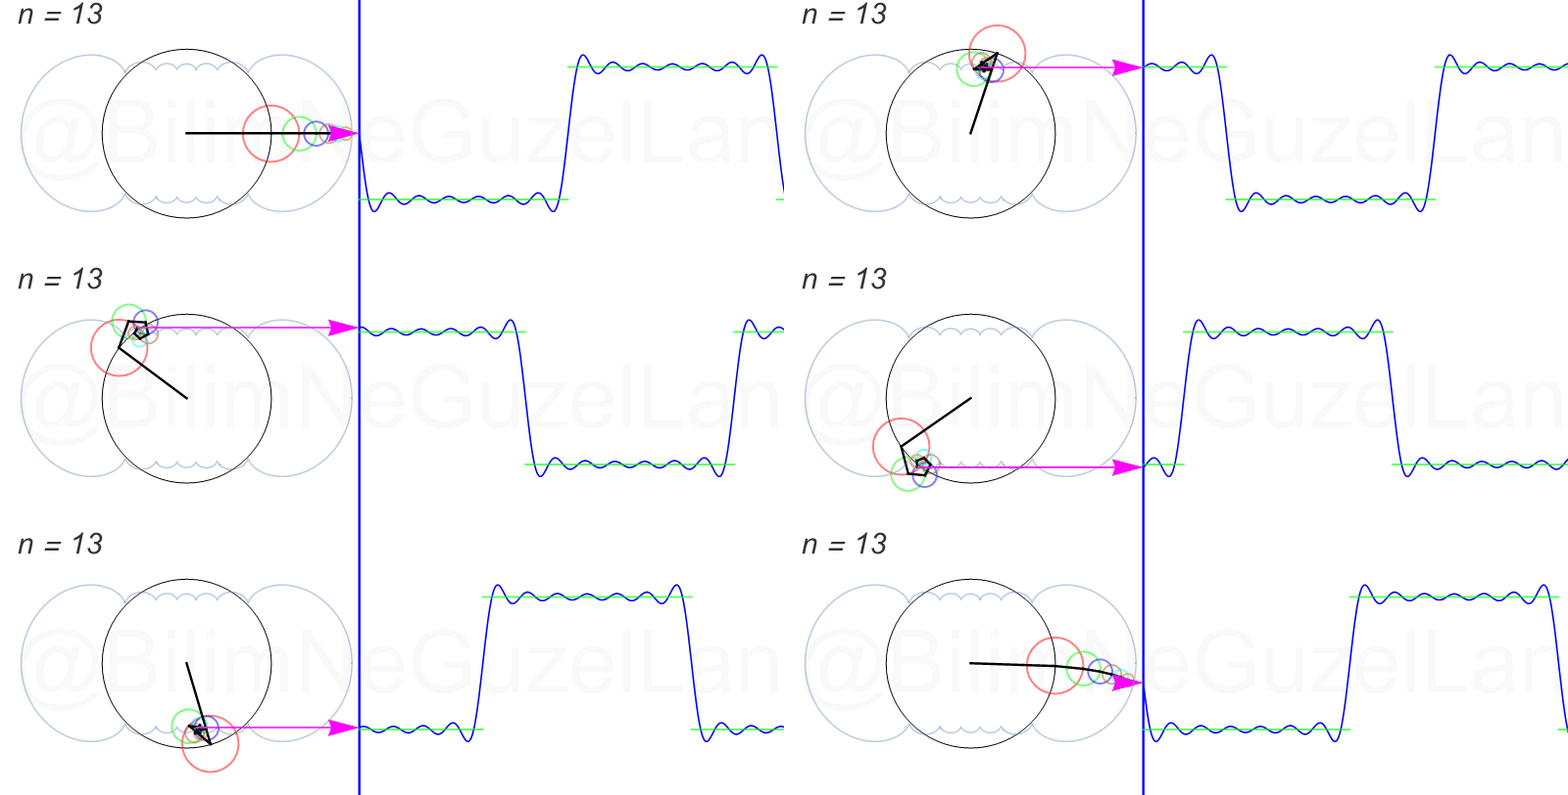
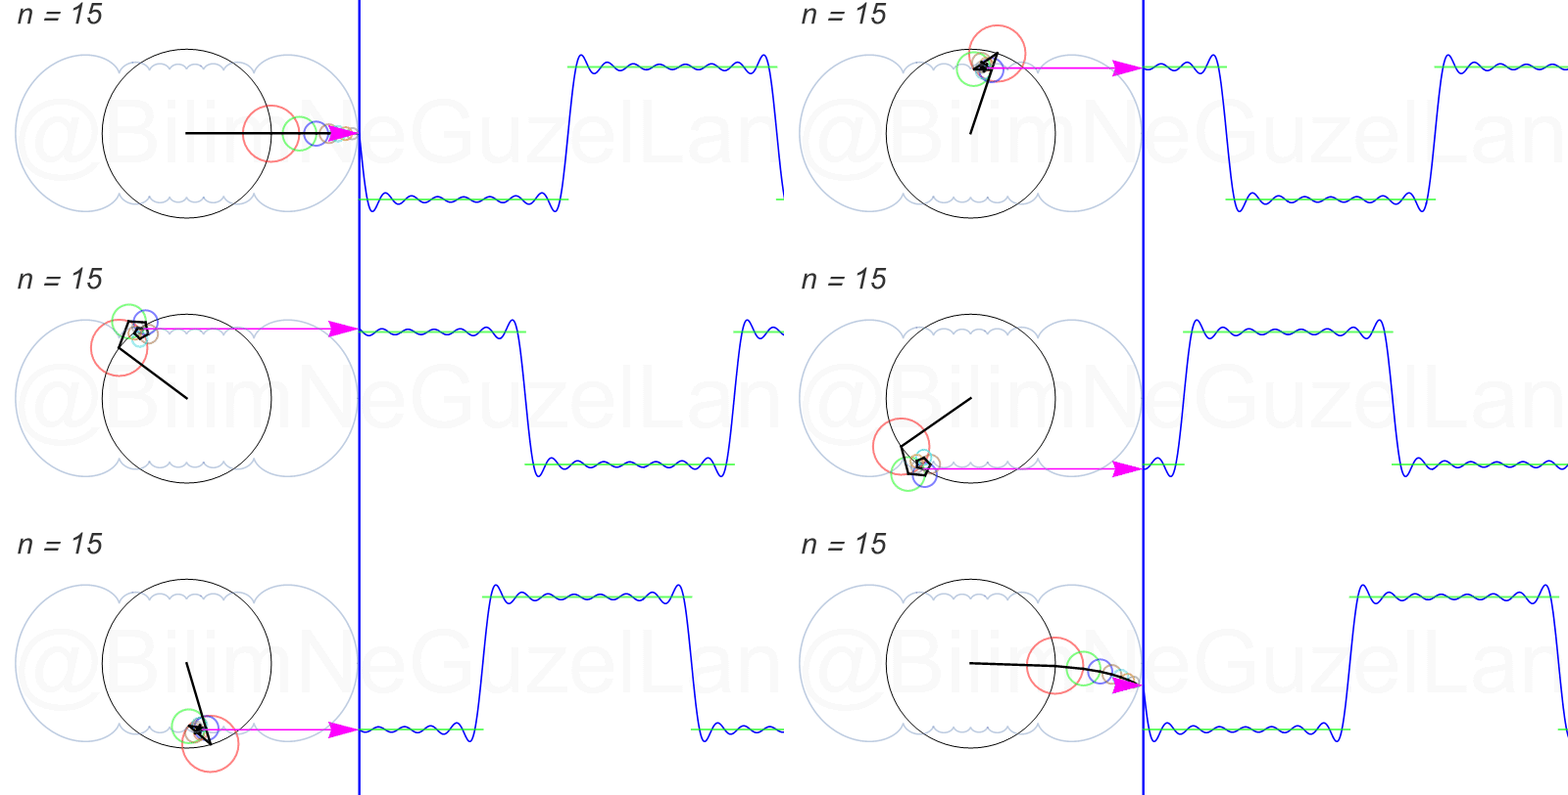
How was that? Isn’t it marvelous? (。◕‿◕。) One can think of a sine wave as the distance covered by the shadow of a ball which turns around a circle. For this “square signal” wave, adding more terms means turning circles with smaller radius around the former circle with higher speeds. Frequency of these turning circles is increasing in odd numbers (leaving the math to you). As we add more circles (more n’s), we get closer to the function that we started with (green lines). Also, you might notice the curves that I added transparently in the background. These curves are known as the cycloid curves! (I mentioned them in a previous article [It’s in Turkish by the way])
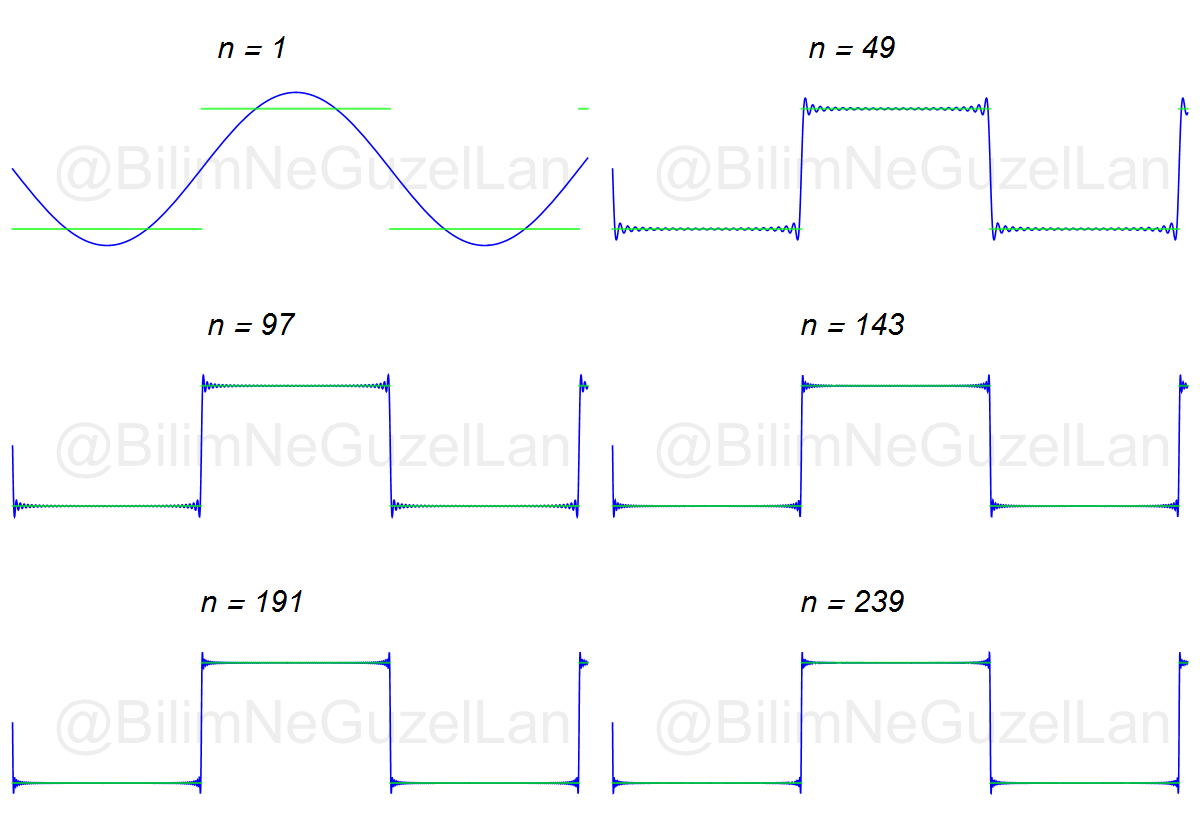
I can show how it approaches to the function as we add more terms in this way : We can add terms up to \(n = 240\)!
Allons-y! Now we take a “saw-tooth-like” signal and expand it to a Fourier series.

When we expand it to a Fourier series, we obtain the following relation:
\(f(x) = \displaystyle{\frac{1}{2}} -\displaystyle{ \sum \limits_{n = 1}^{\infty}\left( \frac{1}{n \pi}\right)\sin\left(\frac{n \pi x}{L}\right)}\)
Again, the more terms we add, the closer we get to this function. In animations below, I presented cases for \(n = 1,2,3,4,5,6,7,8\).


The transparent curve is, indeed, a cycloid curve!
Finally, I will expand a triangle-shaped wave to a Fourier series, but it is not as funny as the previous ones. The “triangular wave” is this:
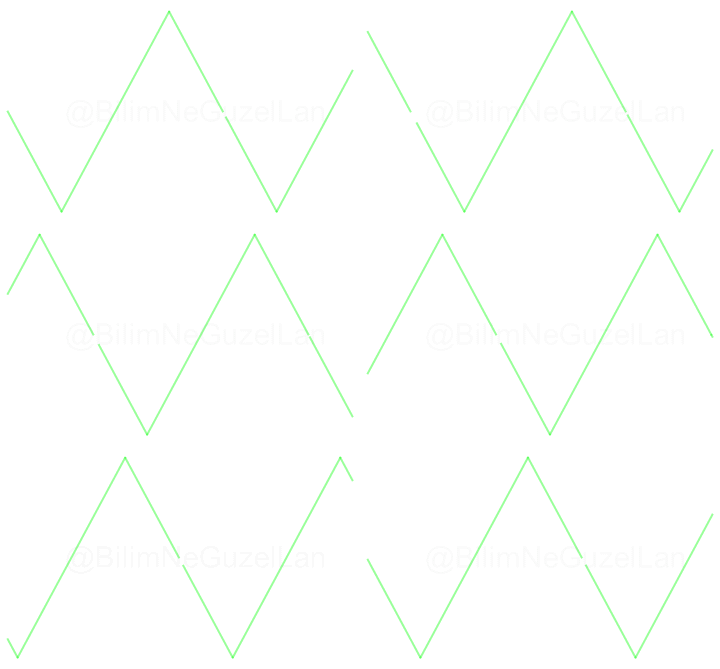
I derived its Fourier transformation as follows:
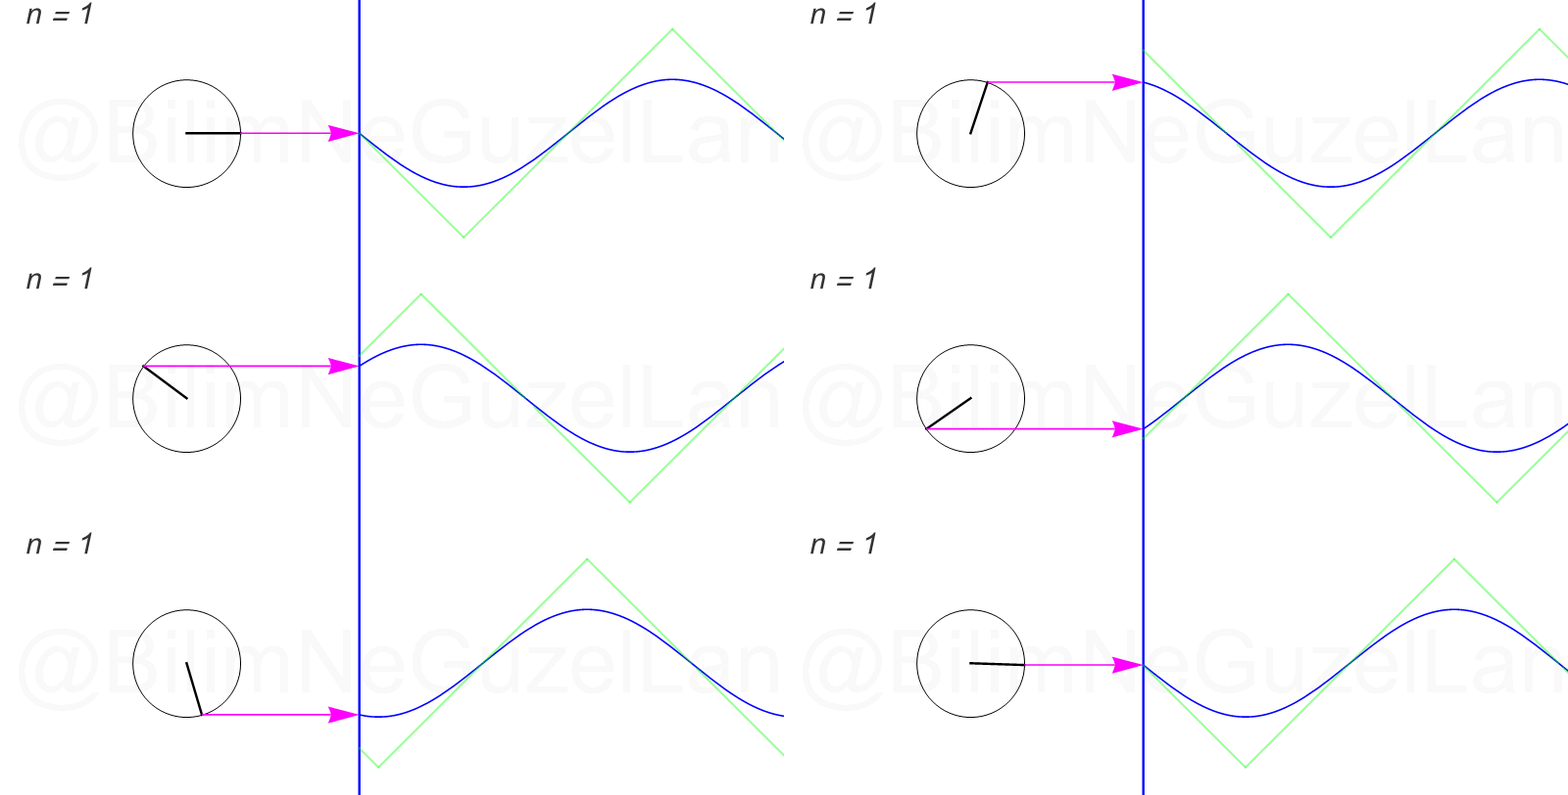
\(f(x) = \displaystyle{ \sum \limits_{n = 1,3,5,7,…}^{\infty} \left(\frac{8}{\pi^2} \frac{(-1)^{\frac{(n-1)}{2}}}{n^2}\right)\sin\left(\frac{n \pi x}{L}\right)}\)
As we add more terms, circles rapidly get so small that they don’t look nice as the previous ones. Anyway, I am adding animations for the first three terms as \(n = 1,3,5\) :
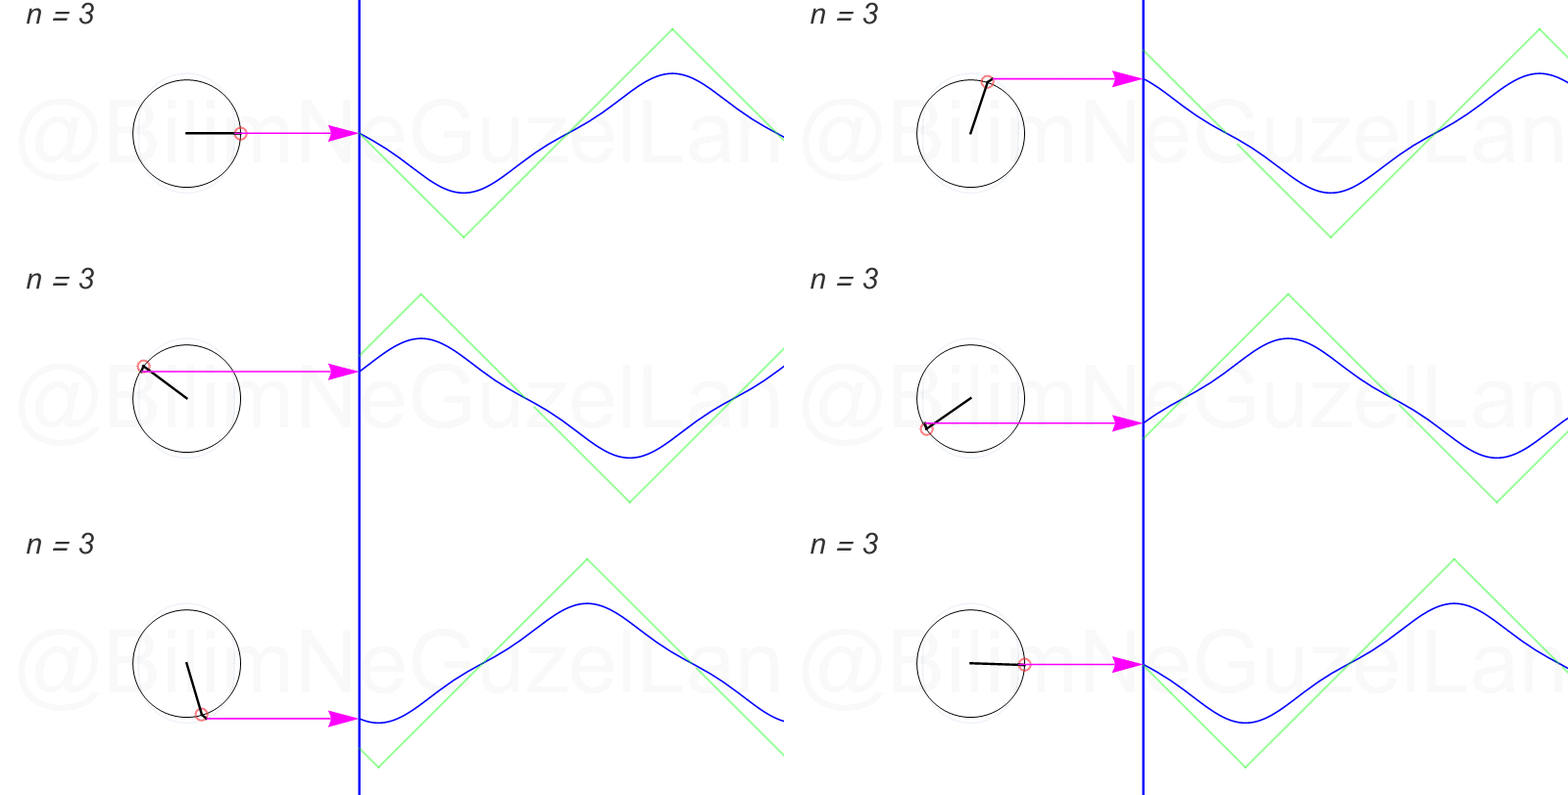
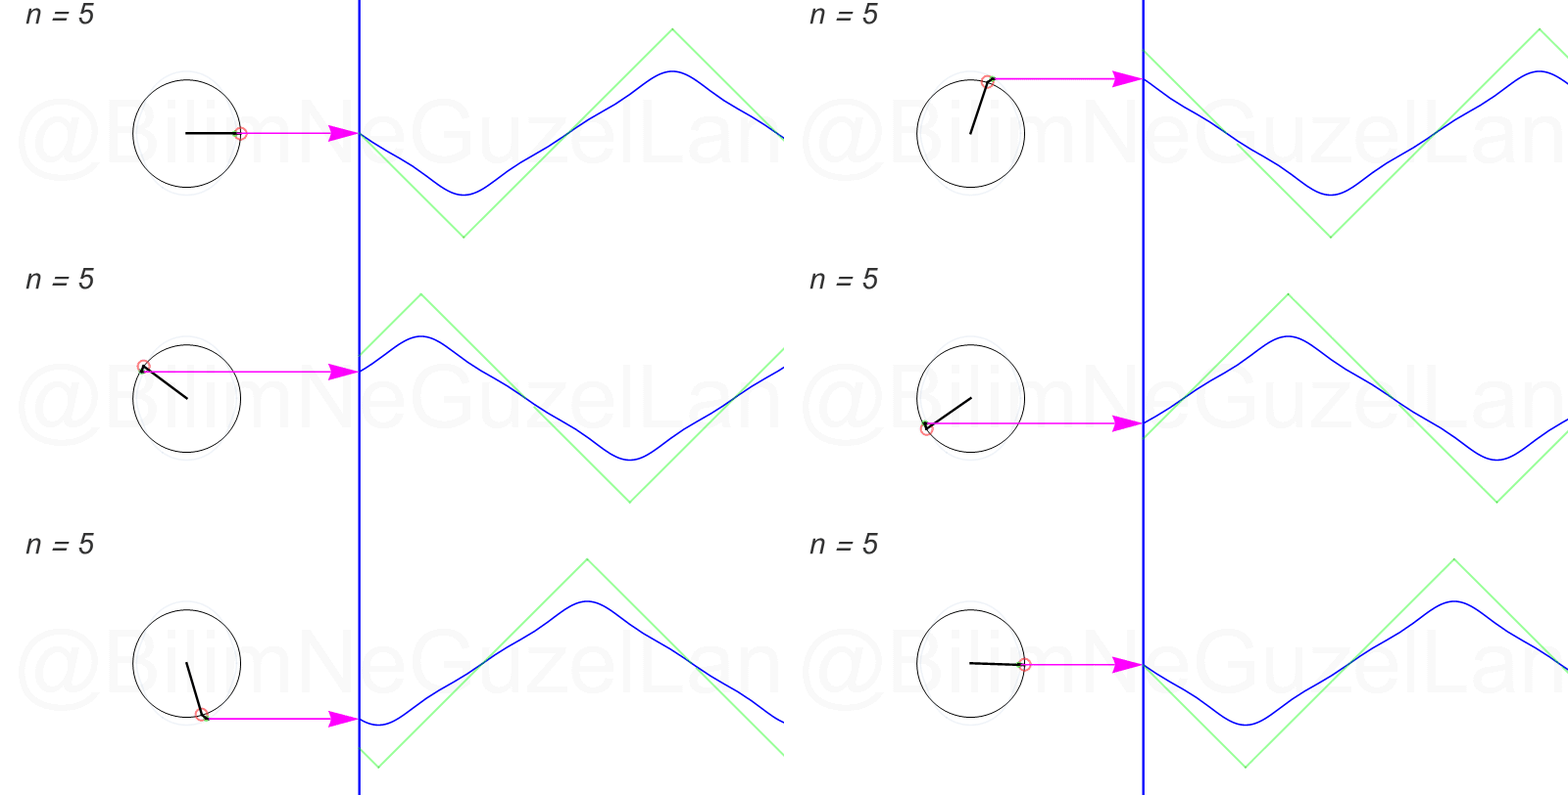
So, where do we use this wisdom? Basically, everywhere! This Fourier analysis thing is like four operations in engineering or science. For example, you have a signal like a noise. You want to analyze it. Suddenly, the Purrier Transform jumps into your lap, and says (or meows) how many waves are there for each frequency.
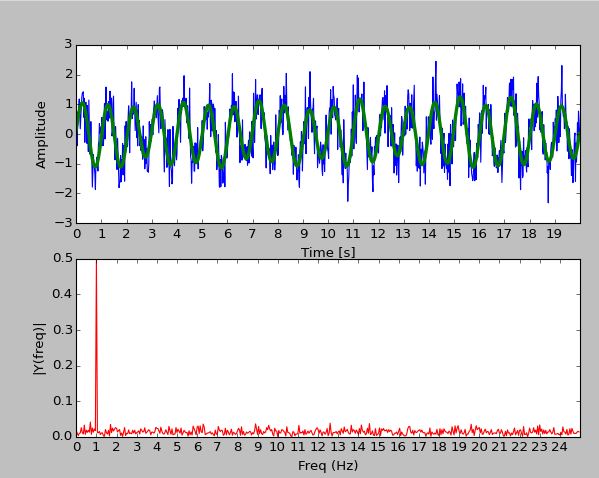
In the figure above, you obtain the Fourier transform of a sound, and it says that the proportion of a wave with specific frequency (1 Hz) is very high with respect to others in the composition of this sound.T
here are a lot of charming applications of this in image and audio processing. I would like to show you, here, an interesting application.
In this work, sound can be extracted from a video by using a very sophisticated Fourier analysis.It means that, you can catch all your neighbor’s gossips about you just by silently videotaping her flower in the living room, which is… also a little bit creepy.
Article and animations: Bilgecan Dede
Special thanks for translation: Gurkan Sonmez (Unfortunately there are no articles of him yet)
The original article in Turkish: Fuyye Serisi
Doga Kurkcuoglu
Yazar: Doga Kurkcuoglu (tümünü gör)
- Bouncing Cubes and π (3Blue1Brown) - 14 January 2019
- Follow up to Fourier Series - 23 December 2018
- Purrier Series (Meow) and Making Images Speak - 11 December 2018

Music and Sound Design Implications seem likely from your work.
Synthesis from additive sine waves is nothing new (Additive Synthesis and in particular Fast Fourier Transform FFT) but I haven’t seen anyone that has tried your technique to recreate sound. I think the future of sound design and things like samplers (For example piano or violin played by a keyboard that play backs samples of music) are soon to be a thing of the past once additive synthesis is developed more. I feel like we are still stuck in 2004 in music production with additive synthesis. Would love to know if anyone is looking at this work to be used with audio re-synthesis?
Merhaba! Smarter Everyday brought me hear (and the link in one of your replies). Well done! Aferin.
In a certain sense, the attempt of Ptolemy of describing the movement of the planets through epicycles, is a kind of Fourier decomposition of their real movements, don’t you agree?
wow that’s neat! you should make an applet so people can mess up with it. tsk
Bazı periyodik fonksiyonları rahat bir şekilde fourer serisine açabiyoruz.örneğin ekg dalgalarınıda fourer serisi şeklinde açabirmiyiz yada ekg dalgaları hangi fonksiyonlardan oluşur?
Hi,
Excellent work,
I will keep in touch.
It has been valuable to me.
Thanks
Gerardo DFS
I’m absolutely blown away by this article!
I have read a lot about Fourier series. It has always been a magical thing and finally you have shown me the trick. I love it!
Thank you very much. Is there any chance that you send me the matematica notebooks used to do this? Or the link if you have published it on the wolfram demonstration projects page.
Thank you for your brilliant work!
An astounding and brilliant piece of work. This is the way Fourier should be taught. I’ll be diving into my mathematica to recreate.
Pingback:Fourier Series Visualization Using React Hooks - 浮生插电
Pingback:Coding Challenge #125: Fourier Series | Watch Movies Online
beautiful work!!
Pingback:Using Blender to run Python and visualizing the Fourier Series - 浮生插电
Artykuł godny polecenia. Gratulacje!!!
Piękno matematyki w czystej formie.
You are a genius. Thank you. Salutes you from Argentina.
How can I resolve Gibbs phenomenon? You cannot just add up term by term because it is an infinite serie, not summation, as you can see that summation of continous function to get a discountinous fuction like square wave fuction, so overshoot and undershoot occur at jump point?
This is amazing you blow my mind !
If I understood correctly you did the animations on Mathematica ?
If it the case would you be willing to share the files ? I’m an engineering student and I would love playing around with Matematica and those animations.
Thanks !
I always disliked Fourier because, for the most part, I did not understand its importance. I YouTubed it, which led me to Smarter Every Day, which led me to this article. Also, I never understood how sinusoidal waves could create square and saw-tooth waves, but now I know. I must say the video and this article helped me understand its importance. Creating images from pure sinusoidal signals is mindblowing.
Thanks! Regards from Pakistan!
Wonderful! Congrats and thank you very, very much. Beautiful work.
Wow, wonderful work
Hola aprecio mucho tu trabajo y creo que es un articulo que sirve como referencia para muchas personas que comienzan en el tema de Series de Fourier. Por lo que veo importante corregir un error en la formula principal..
f(x)=… [an sin(nx) + bn cos(nx)]
El error que veo es que multiplicas an por Sin(nx) cuando debería ser an * Cos(nx) y bn * Sin(nx).
Espero mi observación sea correcta y pueda ayudar, de no estar en lo correcto quisiera saber la razón para aprender más y resolver mi duda.
Saludos.
Hello, I really appreciate your work and I think it is an article that serves as a reference for many people who are starting out on the subject of Fourier Series. For what I see important to correct an error in the main formula..
f(x)=… [an sin(nx) + bn cos(nx)]
The error I see is that you multiply an by Sin(nx) when it should be an * Cos(nx) and bn * Sin(nx).
I hope my observation is correct and can help, if it is not correct, I would like to know the reason to learn more and resolve my doubt.
Greetings.
wow I love it
Great job, i would like to help with a comment, actually is an error that i saw in the geneal formule f(x) after this paraph
Although it was first discovered by Euler, Fourier realized and demonstrated its importance in analysis of waves; therefore it is known by his name. It is defined as (well, yes it has many forms, but Fourier defined it as):
you wrote an Sin(nx) insted of an Cos(nx) and bn Cos(nx) insted of bn Sin(nx)
I hope this comment can help.
https://thumbmachine.com
You actually explained it very well!
i did understand that for making a square wave you took sine function but to make different kind of random diagrams how are you choosing your functions
i always get stuck in solving problems.
Those circles look like movements of human joints, and the graph looks like a picture drawn by that person. awesome!