Fuyye Serisi ve Görüntüden Ses Çıkarmak
Fourier serisi, tekrar eden bir eğriyi sinüs eğrilerinin toplamı olarak ifade etmektir. Sinüs dalgalarının toplamı şeklinde yazmanın diğer anlamı “hangi frekanstaki dalgadan ne kadar var” anlamına geldiğinden mühendislikte, fizikte, matematikte çok yaygın kullanılır. Altında yatan temel fikir, sinüs ve kosinüs fonksiyonlarının birbirine dik olmasıdır, sanki birbirlerine dik vektörler gibi.
\(\displaystyle{\frac{1}{\pi}\int \limits_{-\pi}^{\pi} {\color{black}\sin({\color{red}n} x)}{\color{black} \sin({\color{blue}m} x)} dx = \begin{cases} 1, & {\color{red}n} = {\color{blue}m} \\ 0, & {\color{red}n} \neq {\color{blue}m}\end{cases}}\)
\(\displaystyle{\frac{1}{\pi}\int \limits_{-\pi}^{\pi} {\color{black}\cos({\color{red}n} x)}{\color{black} \cos({\color{blue}m} x)} dx = \begin{cases} 1, & {\color{red}n} = {\color{blue}m} \\ 0, & {\color{red}n} \neq {\color{blue}m}\end{cases}}\)
\(\displaystyle{\frac{1}{\pi}\int \limits_{-\pi}^{\pi} {\color{red}\sin({\color{red}n} x)}{\color{blue} \cos({\color{blue}m} x)} dx =0}\)
Hatırlatma, iki birim vektör birbirine dik ise aynı sonucu verecekler.
\({\bf \hat{{\color{red}e}}}_{\color{red}i} \cdot {\bf \hat{{\color{blue}e}}}_{\color{blue}j} = \begin{cases} 1, & {\color{red}i} ={\color{blue} j} \\ 0,& {\color{red}i} \neq {\color{blue}j} \end{cases}\)
Bu sonucu ilk Euler fark ettiği halde, Fourier bunun önemini anlayıp dalgaların analizinde çok önemli olduğunu gösterdiğinden onun ismi ile anılır. Tanımı (daha bir çok formu var, bu Fourier’in bulduğu şekli);
\(\displaystyle{f(x) = \frac{a_0}{2} + \sum \limits_{n = 1}^N \left[ a_n {\color{red} \sin(n x)} + b_n {\color{blue}\cos(nx)}\right]},\)
\(f(x)\) seriye açmaya çalıştığımız periyodik bir fonksiyon \(x \in [-\pi, \pi]\), \(a_0\) bir sabit,
\(a_0 = \displaystyle{\frac{1}{\pi} \int \limits_{-\pi}^{\pi} f(x) dx }\)
ve \(a_n\) ve \(b_n\) şöyle tanımlanmışlar:
\(a_n = \displaystyle{\frac{1}{\pi} \int \limits_{-\pi}^{\pi} f(x) {\color{blue} \cos(nx) }dx },\)
\(b_n = \displaystyle{\frac{1}{\pi} \int \limits_{-\pi}^{\pi} f(x) {\color{red}\sin(nx) }dx }.\)
Bir kaç basit fonksiyonun Fourier dönüşümünü göstermek istiyorum. Çünkü çok eğlenceli (ᵔᴥᵔ)
İlk fonksiyonumuz +1 ile -1 arasında gidip gelen sinyal:

Bunu şimdi Fourier serisi şeklinde yazmaya çalışıyoruz. Her bir sinüs eğrisinin sadece bir frekansı var. Hangi frekanslardan ne kadar var onu bulmaya çalışıyoruz. Fourier serisinin sonucunu yazıyorum:
\(f(x) = \displaystyle{ \sum \limits_{n = 1,3,5,7…}^{\infty} \left(\frac{4}{n \pi}\right)\sin\left(\frac{n \pi x}{L}\right)}\)
\(L\), bu \(f(x)\)’in periyodu, bu örnek için \(2\pi\). Aşağıdaki animasyonlarda \(n = 1\)’den \(n = 3,5,7,9,11,13,15\)’e kadar terimleri alarak Fourier serisini göstereceğim. 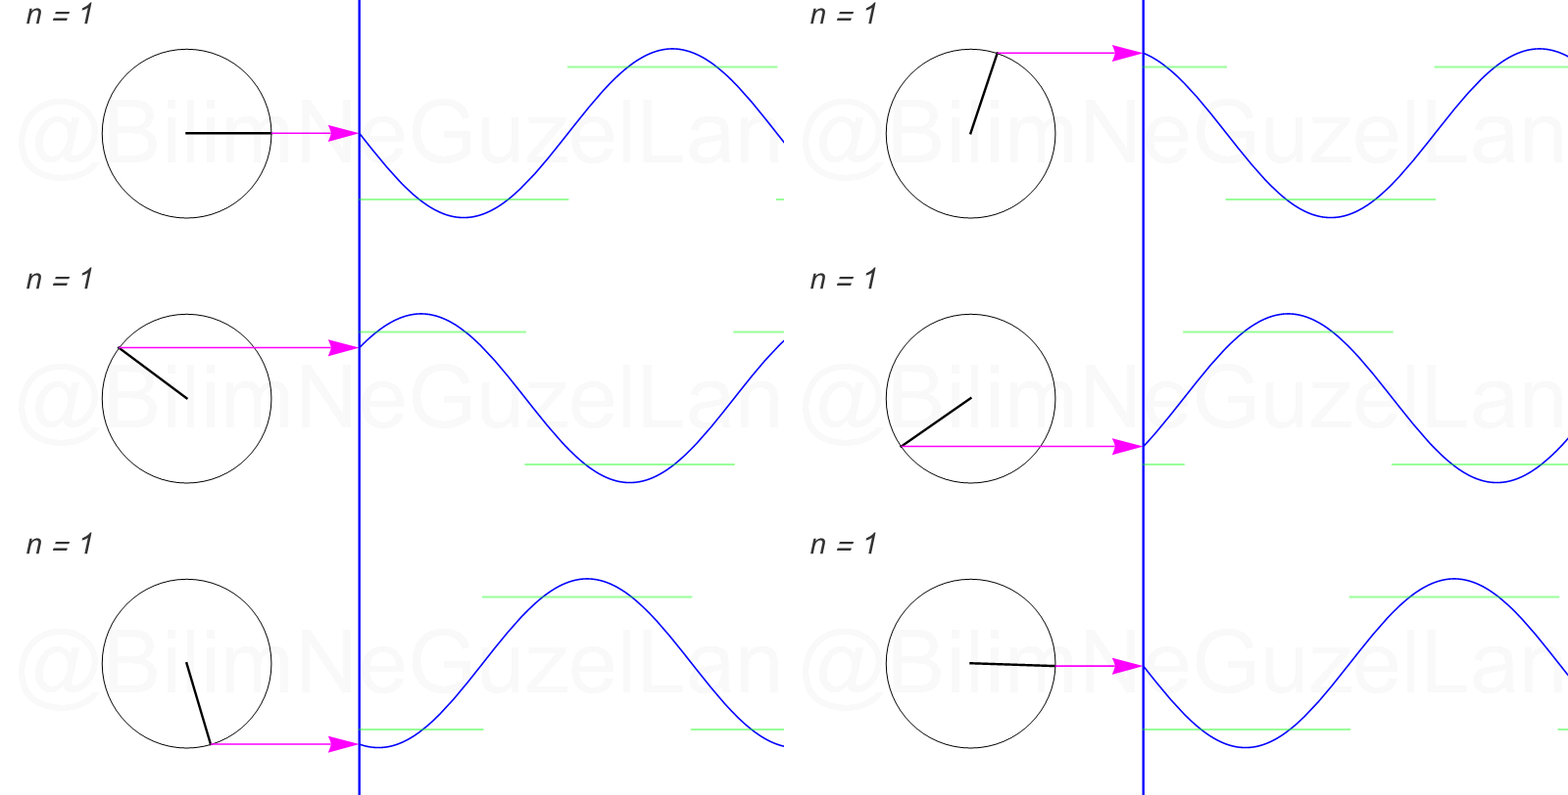
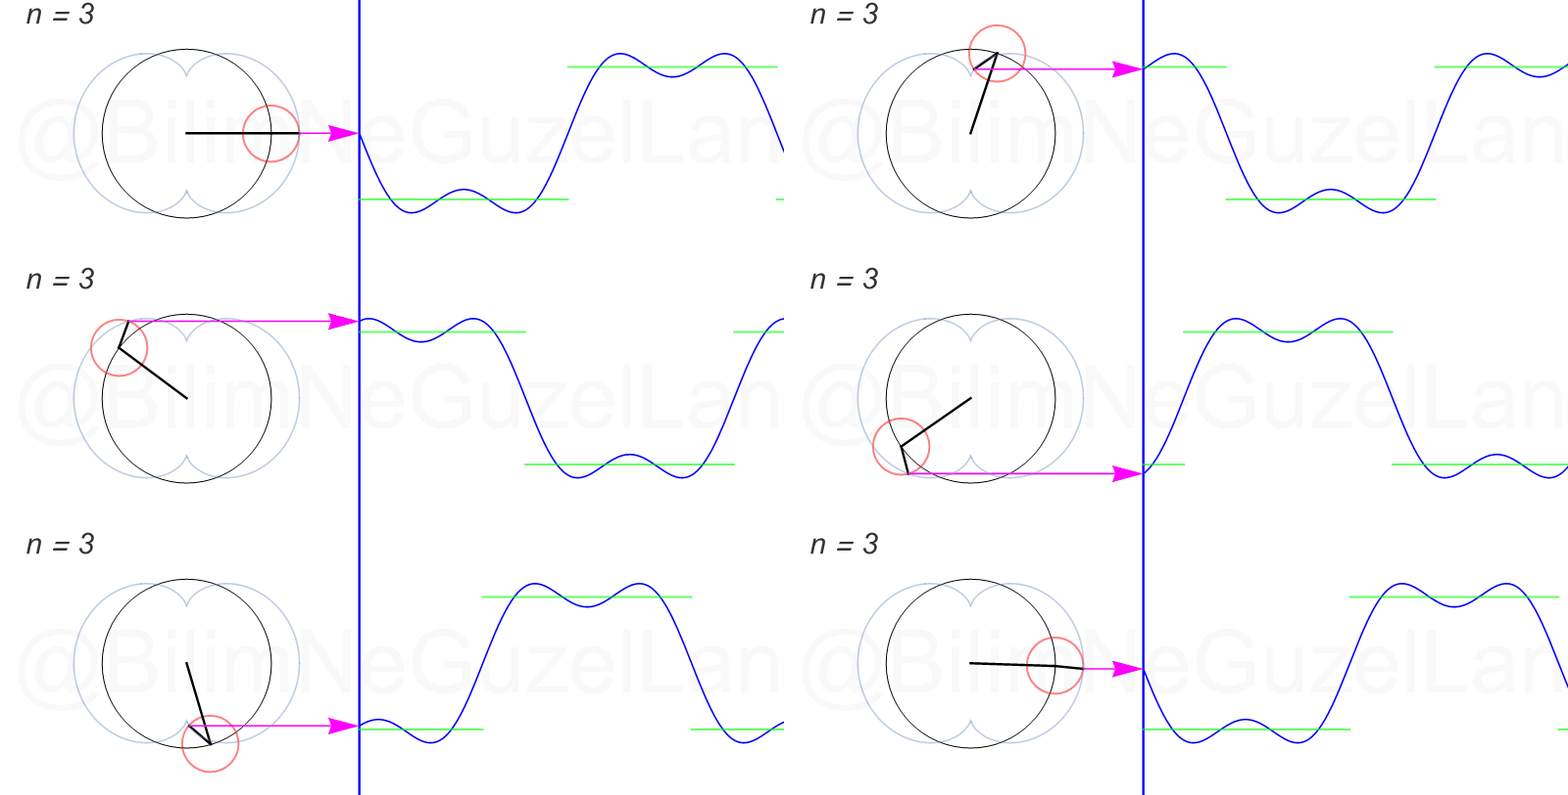
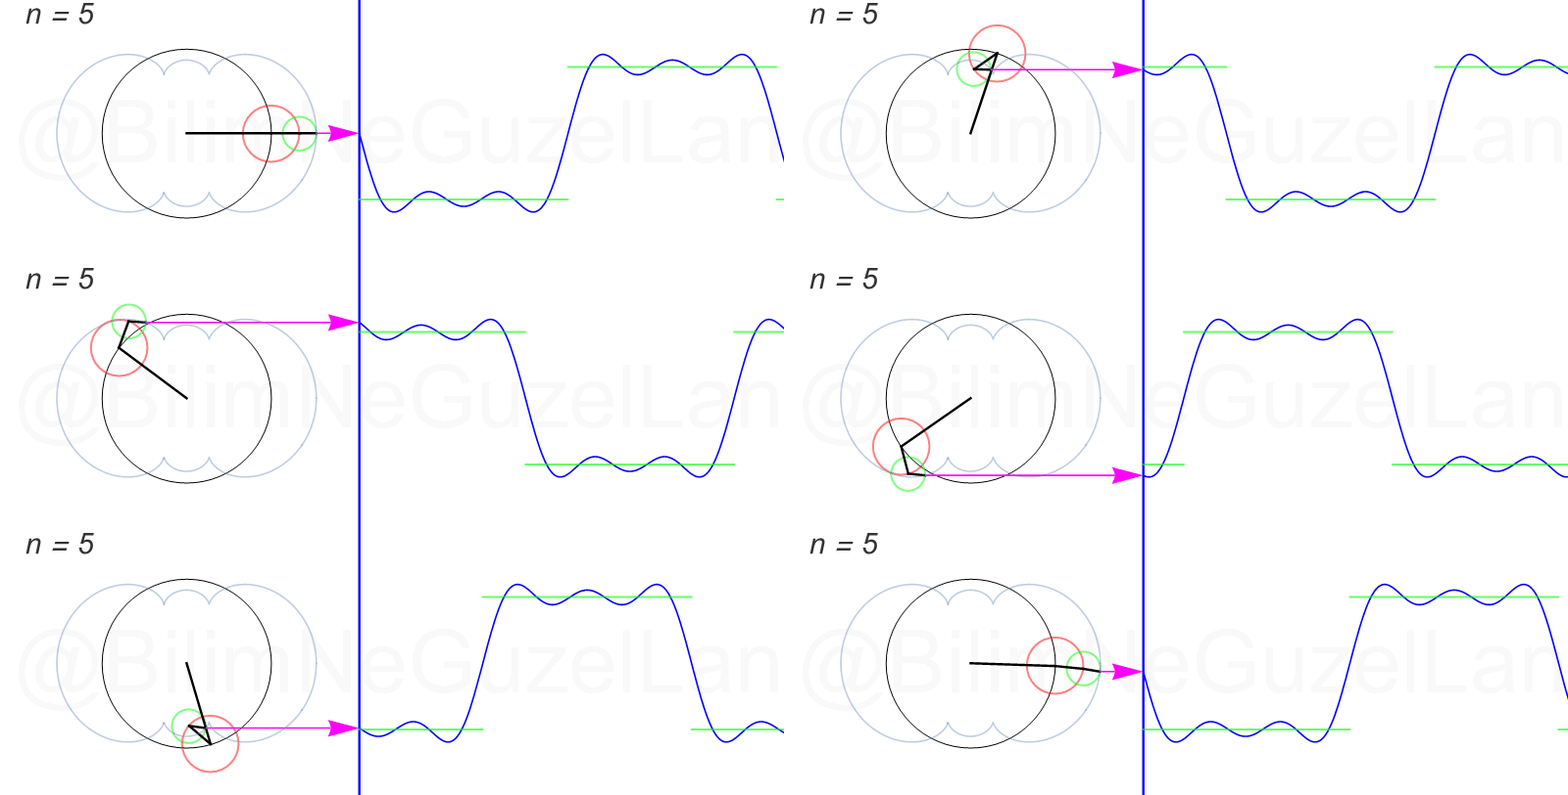
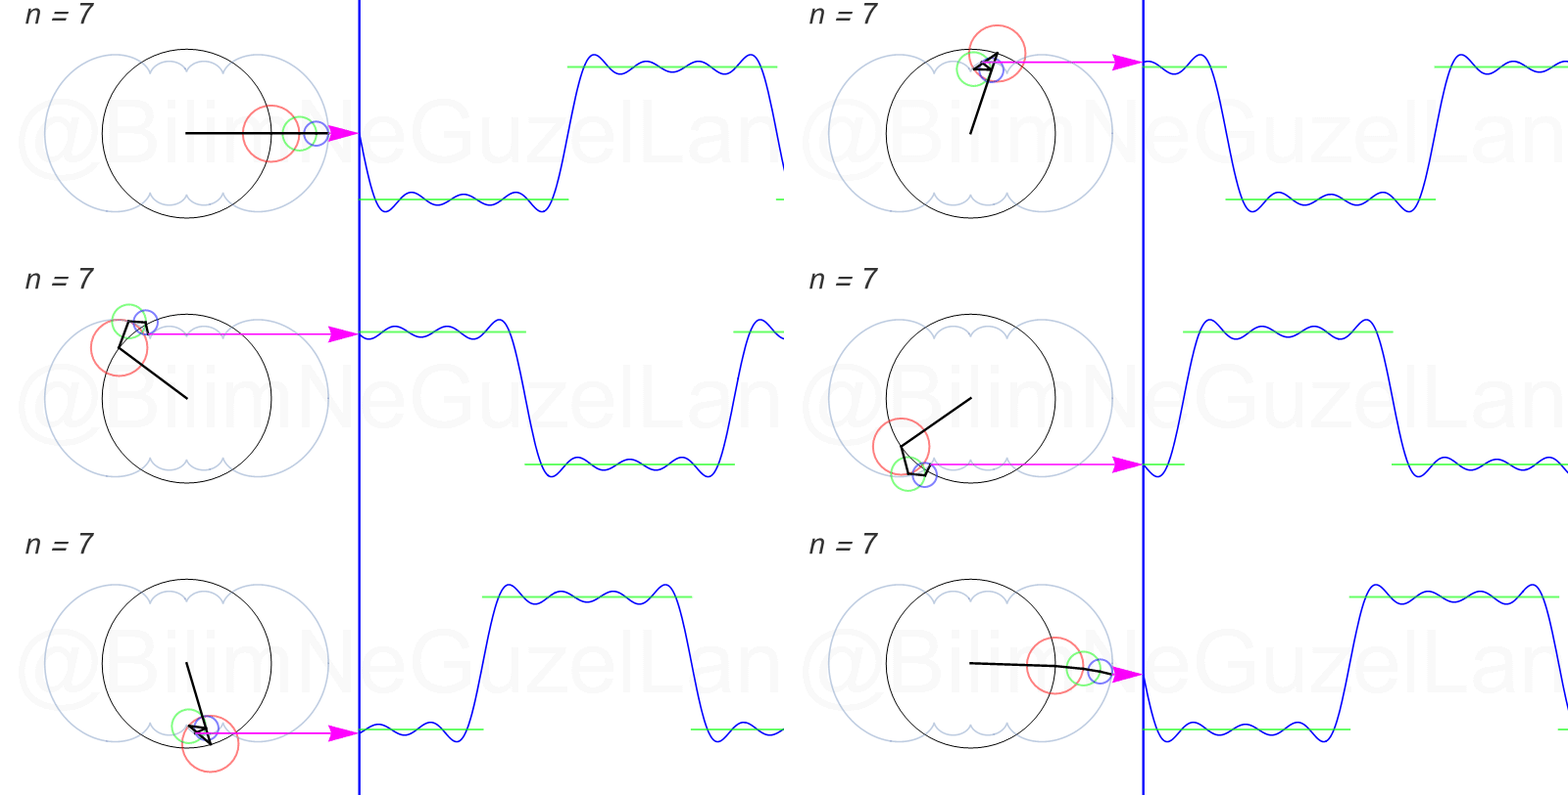
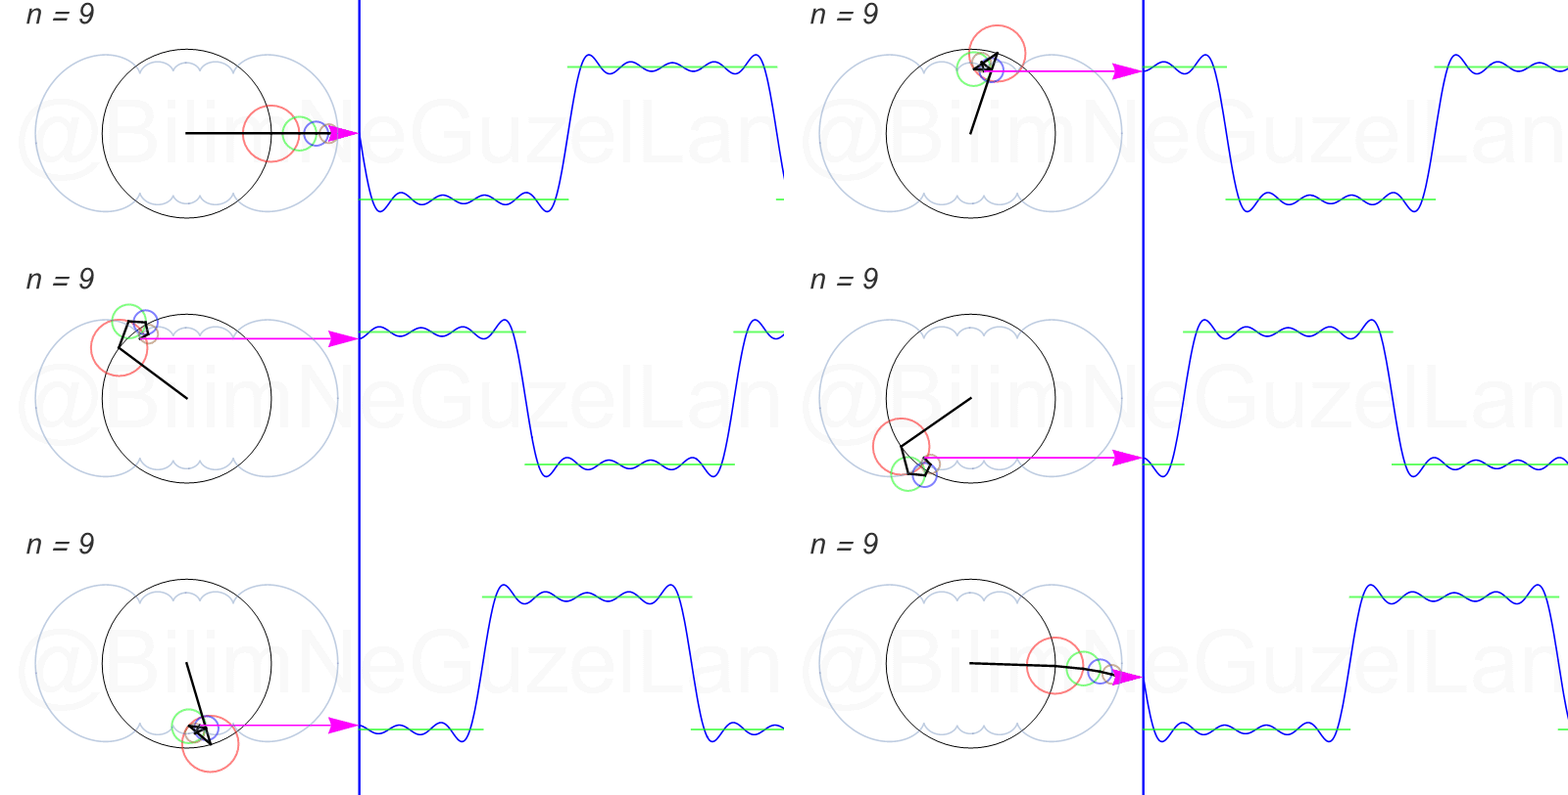
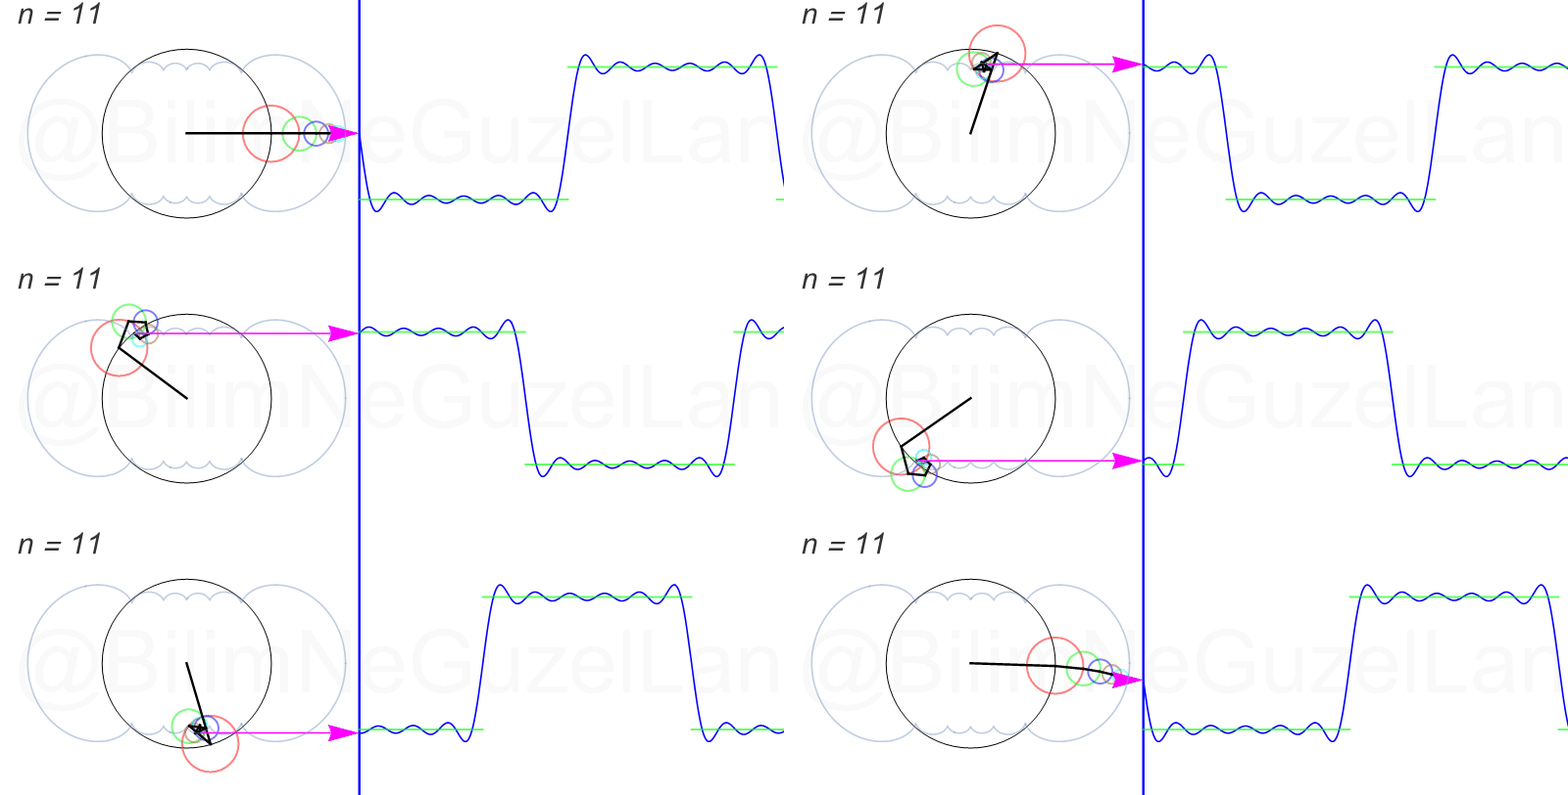
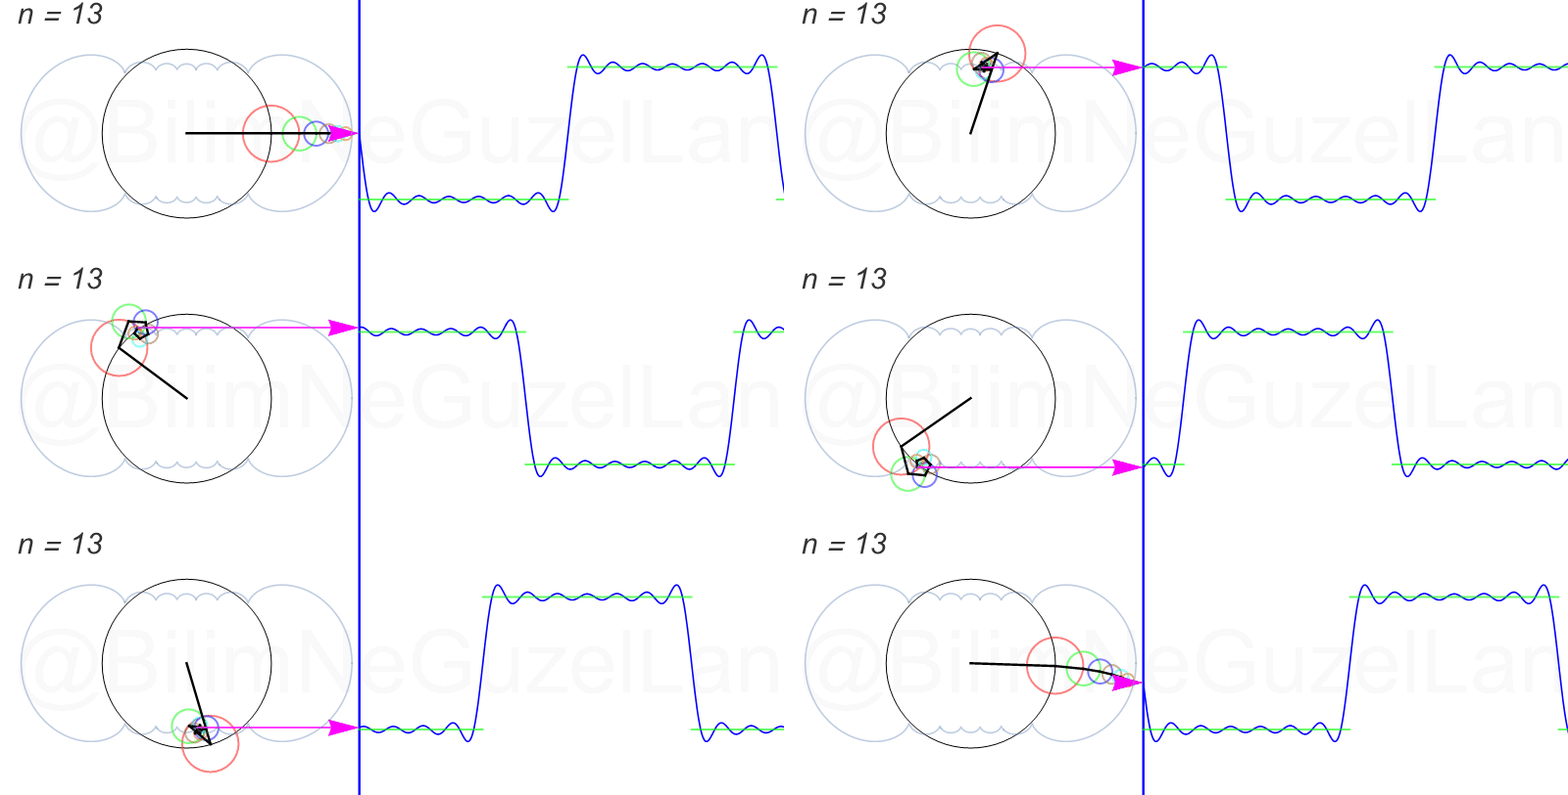
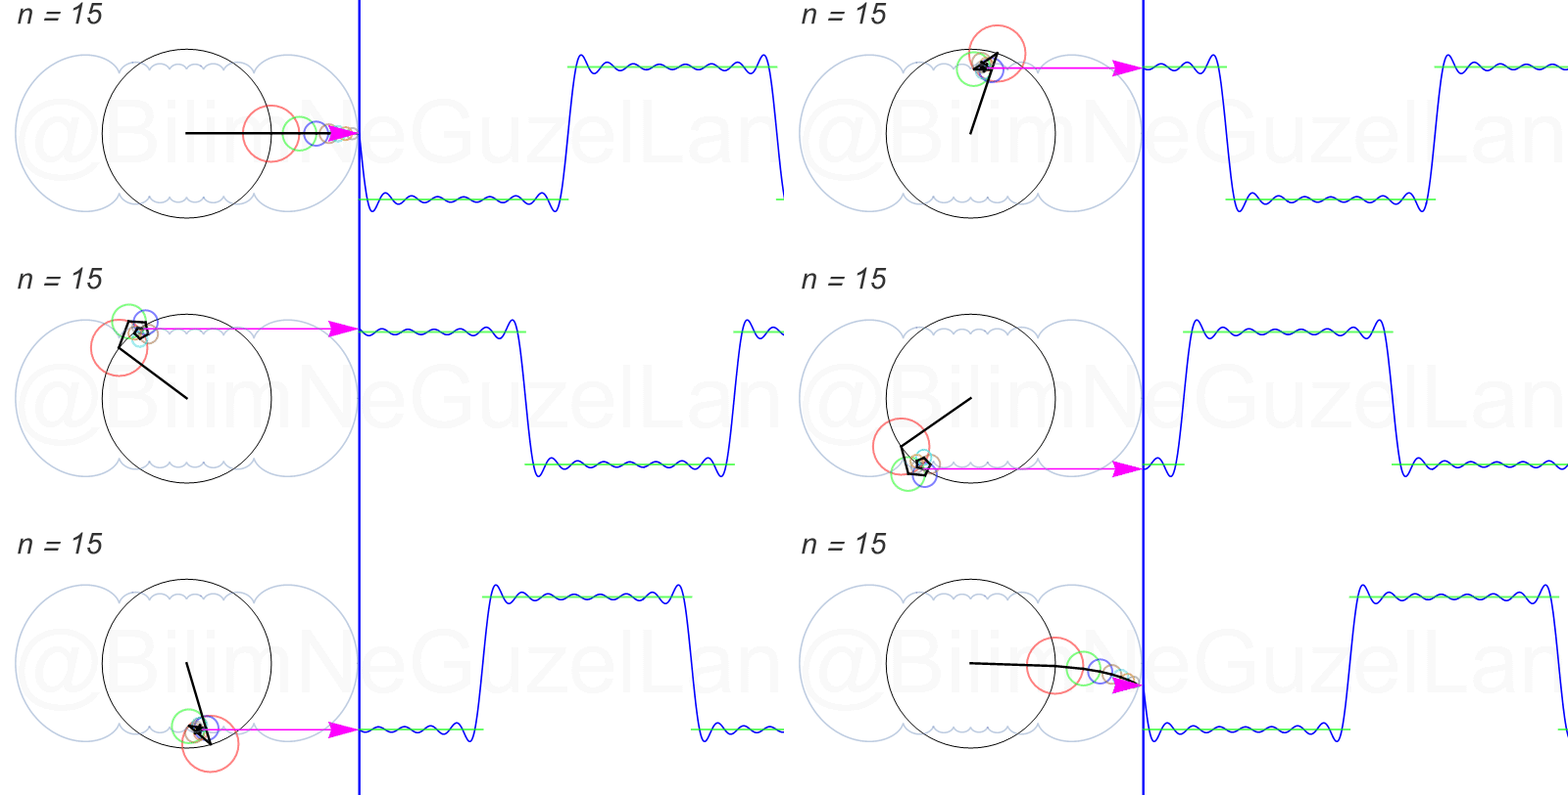
Nasıl, süper değil mi? (。◕‿◕。) Sinüs eğrisi bir çember etrafında dönen bir topun gölgesinin aldığı yol olarak düşünülebilir. Bu “kare sinyal” eğrisinde daha fazla terim eklemek, daha küçük yarıçaplı çemberleri, önceki çember etrafında daha hızlı döndürmek demek. Bu dönen çemberlerin frekansları da tek sayı olarak artıyor (hesabı size bırakıyorum). Daha fazla çember ekledikçe (daha fazla n ekledikçe) başlangıçtaki fonksiyonumuza (yeşil eğri) daha fazla yaklaşacağız. Ayrıca, arkaya transparan olarak eklediğim eğrileri fark etmişsinizdir. Bu eğriler de cycloid eğrileri! (başka bir yazımda cycloid eğrilerini anlatmıştım).
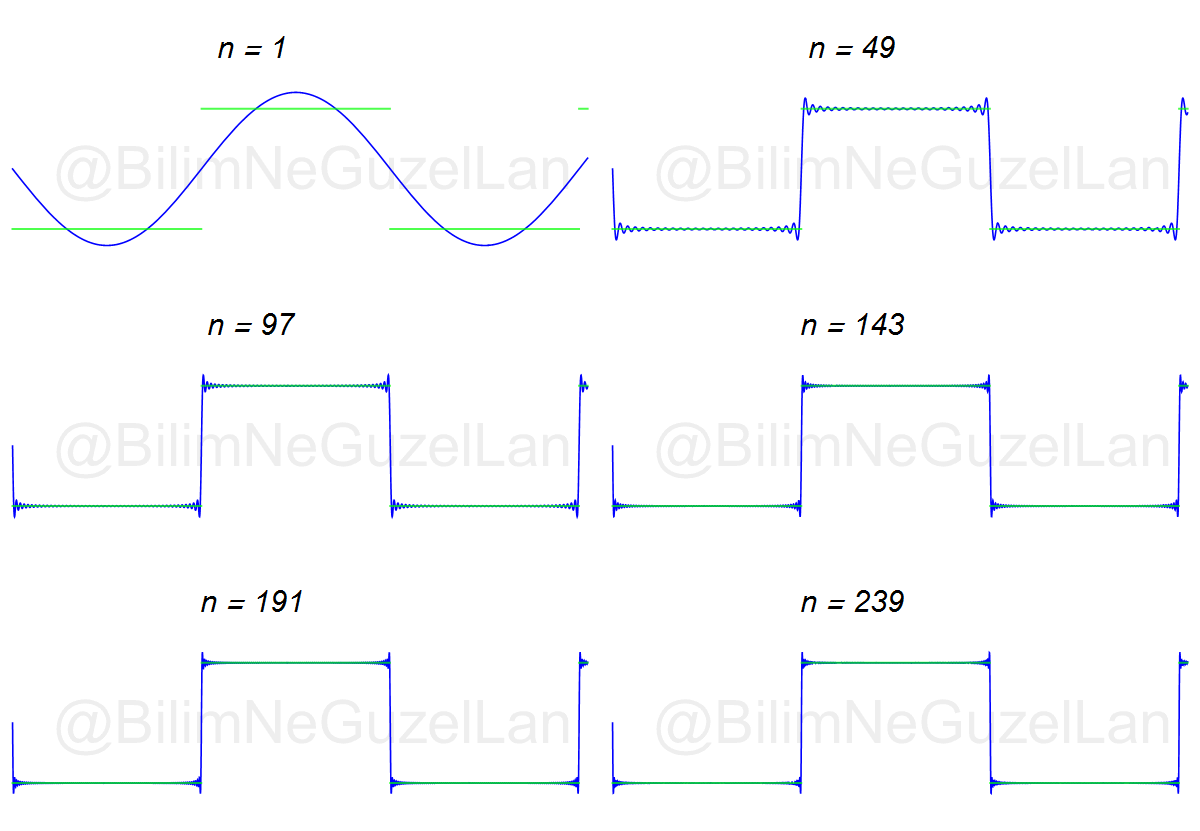
Daha fazla terim ekleyerek fonksiyonun kendisine yaklaşmayı şöyle gösterebilirim: \(n = 240\)’a kadar olan terimleri eklersek nasıl görünür?
Devam, şimdi de şöyle “testere ucu” şeklinde bir sinyal alalım ve onu Fourier serisine açalım.

Bu fonksiyonu Fourier serisine açtığımızda şu sonuca ulaşıyoruz:
\(f(x) = \displaystyle{\frac{1}{2}} -\displaystyle{ \sum \limits_{n = 1}^{\infty}\left( \frac{1}{n \pi}\right)\sin\left(\frac{n \pi x}{L}\right)}\)
Tekrar, ne kadar terim eklersek bu fonksiyona o kadar daha iyi yaklaşıyoruz. Aşağıdaki animasyonlarda \(n = 1\)’den \(n = 2,3,4,5,6,7,8\)’e kadar olan terimleri ekledim.


 Transparan eğri tekrar bir cycloid eğrisi!
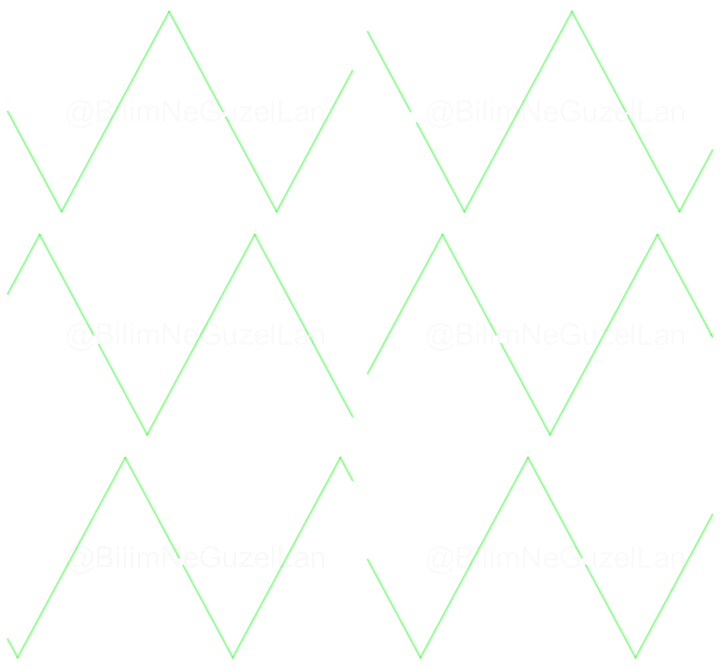
Son olarak, üçgen şekilli bir dalgayı Fourier serisine açacağım, fakat bu öncekiler kadar eğlenceli değil. Bahsi geçen “üçgen dalga” şu:
Fourier dönüşümünü şöyle buldum:
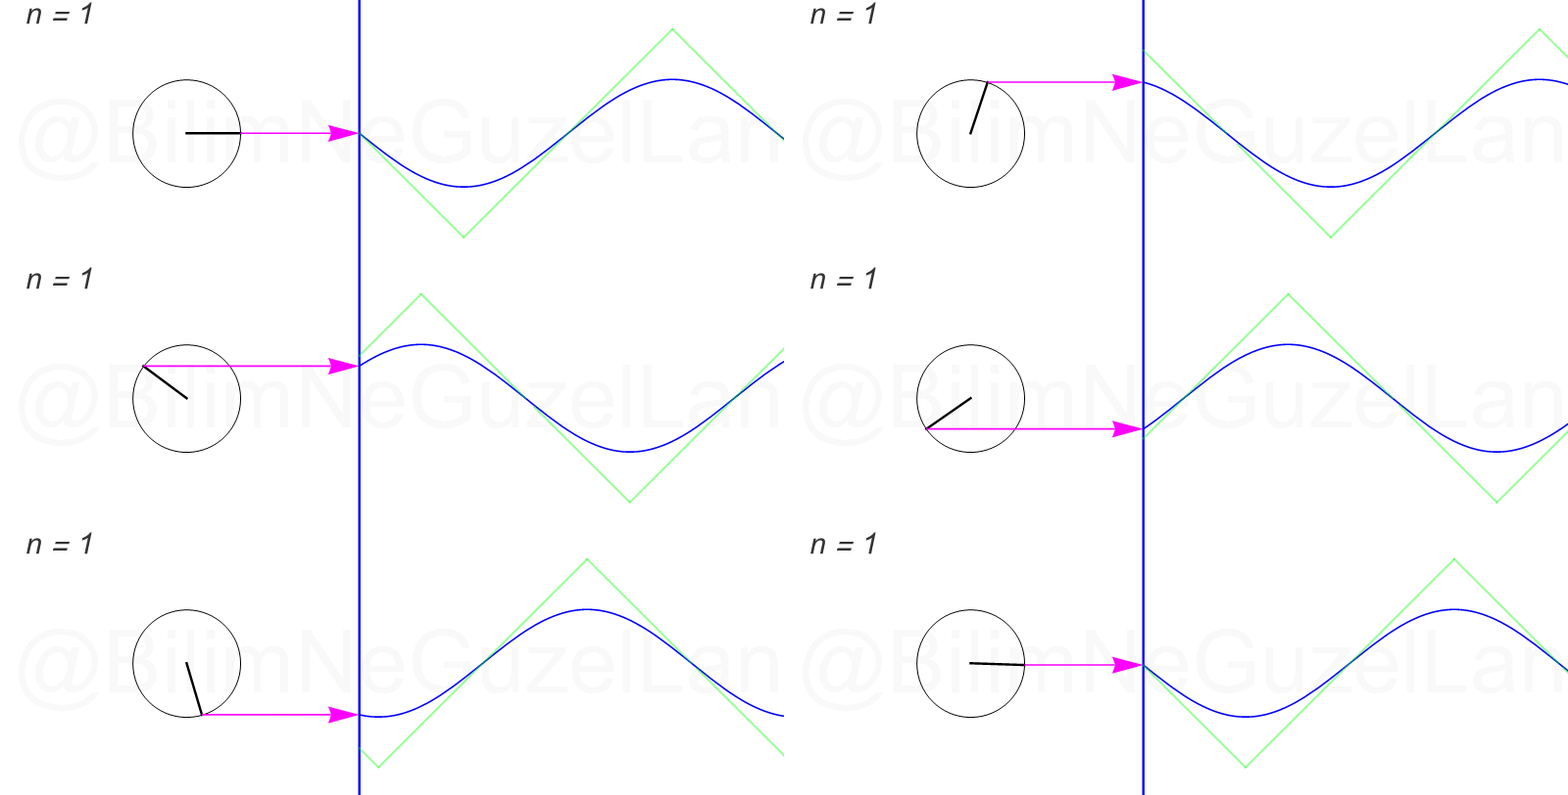
\(f(x) = \displaystyle{ \sum \limits_{n = 1,3,5,7,…}^{\infty} \left(\frac{8}{\pi^2} \frac{(-1)^{\frac{(n-1)}{2}}}{n^2}\right)\sin\left(\frac{n \pi x}{L}\right)}\)
Daha fazla terim ekledikçe çemberler çok hızlı küçülüyorlar. Öncekiler gibi güzel görünmüyorlar. Olsun, ben ilk üç terimin \(n = 1,3,5\) animasyonlarını ekliyorum:
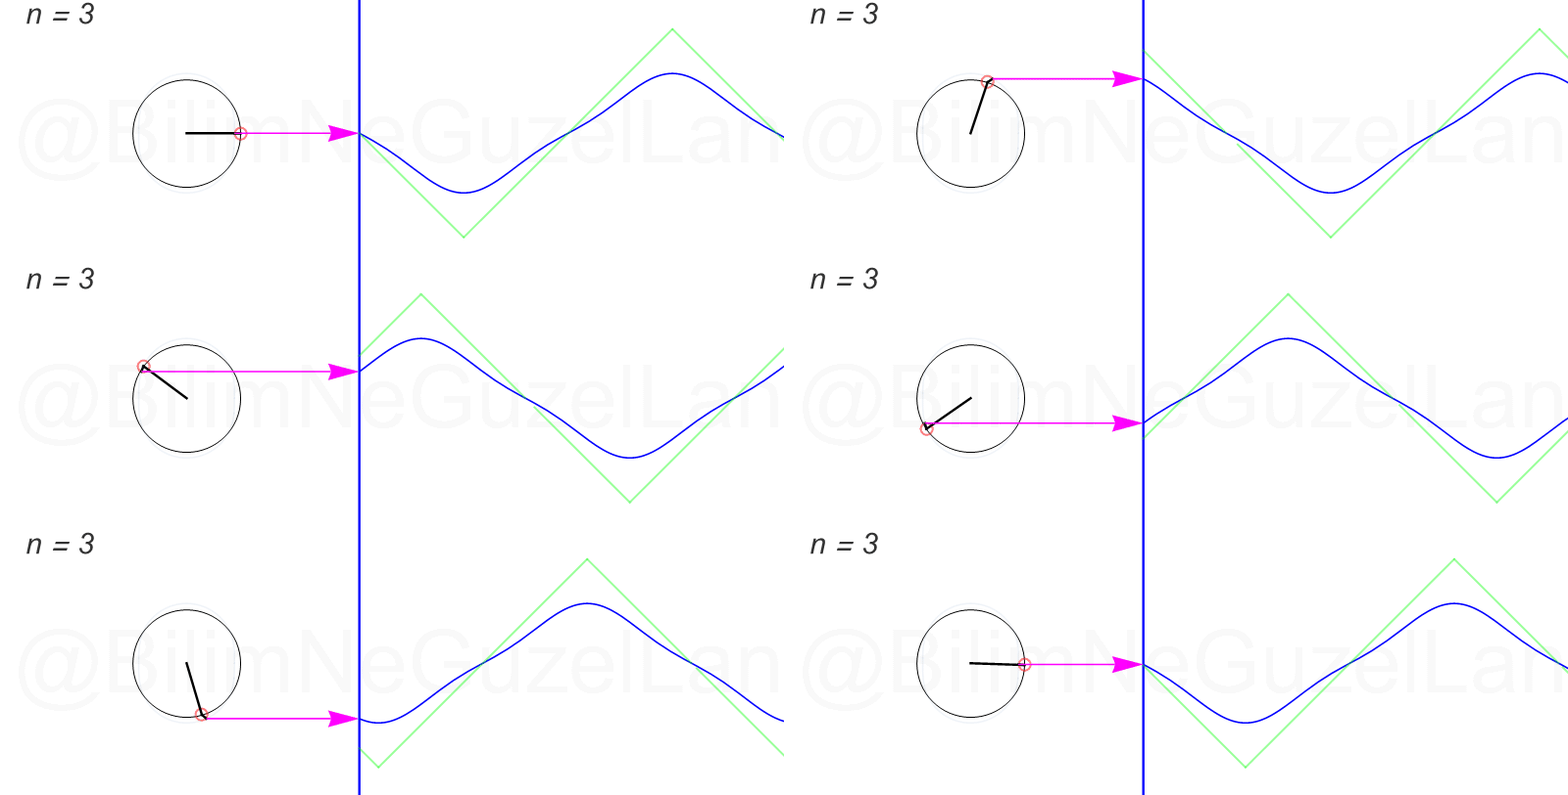
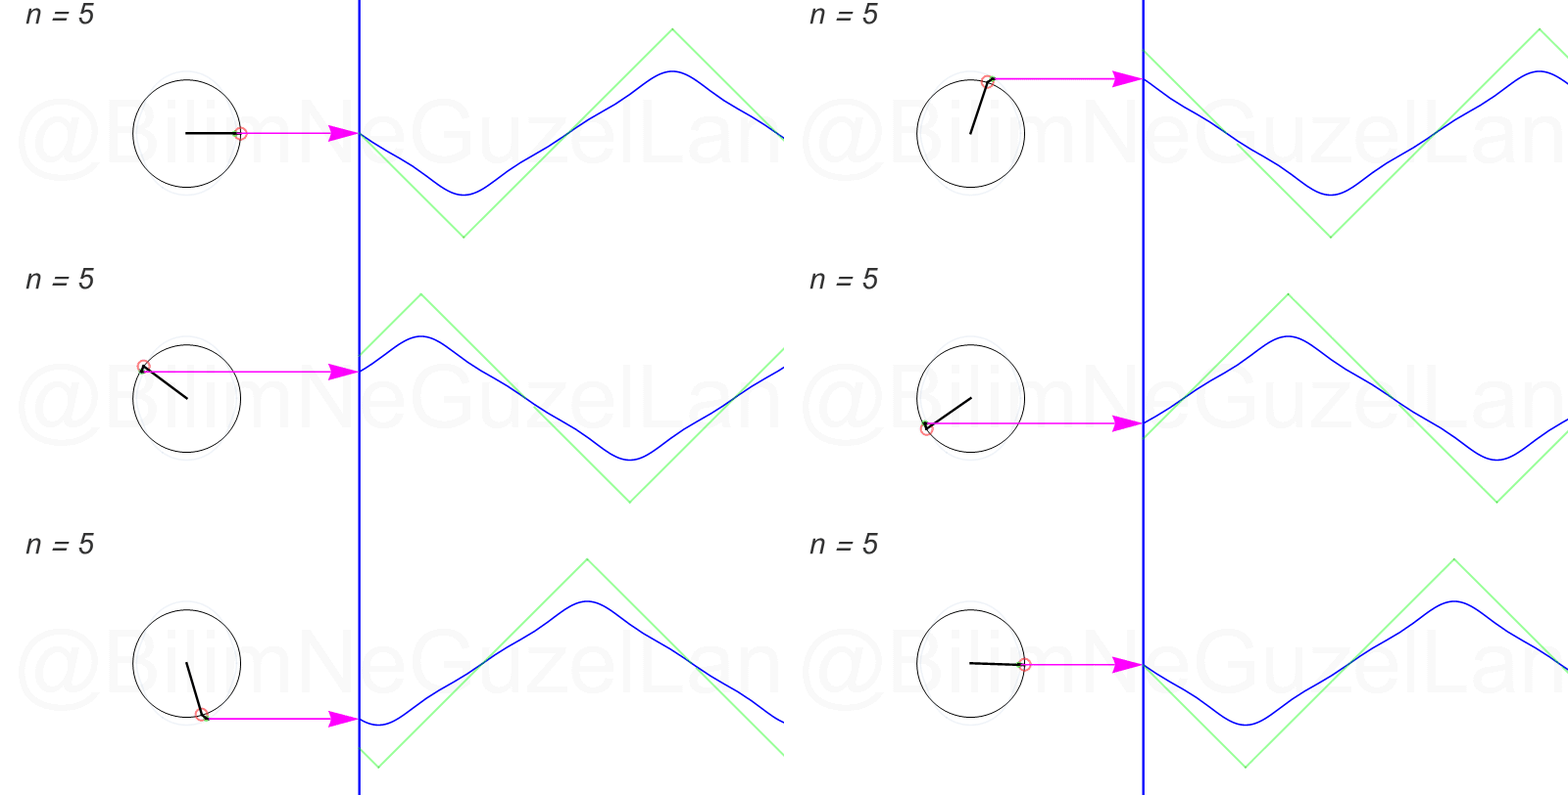
Peki, bu bilgiyi nerede kullanacağız? Çok yerde. Mühendislikte ve temel bilimlerde dört işlem gibi bir şey Fourier analizi. Mesela, elinizde gürültü gibi bir ses dalgası var. Bunu ayrıştırmak istiyorsunuz. Hop, hemen Fuyye amca yetişti yardımınıza. Hangi frekanstan ne kadar dalga olduğunu söyledi.
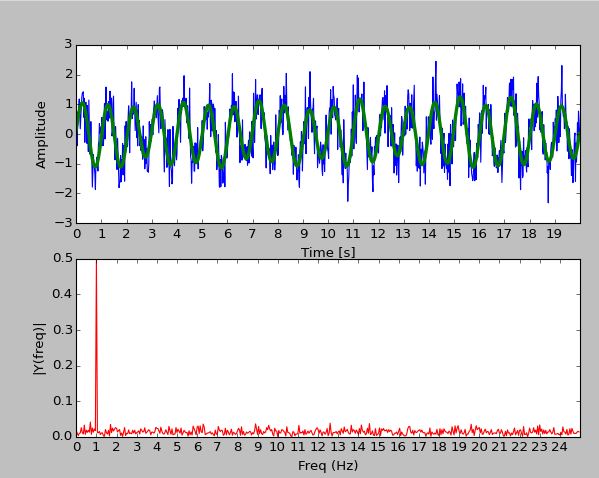
Yukarıdaki görselde, yukarıdaki sesin Fourier dönüşümünü alıyorsunuz ve size bir frekanstan (1 Hz) daha fazla oranda dalga olduğunu söylüyor.
Bunun görüntü işlemede, ses işlemlerinde çok güzel kullanımları var. Burada çok ilginç bir kullanımını göstermek istiyorum.
Bu çalışmada, çok sofistike bir Fourier analizi kullanılarak bir videodan ses çıkarılabiliyor. Yani, komşunuzun salonundaki çiçeği kamera ile sessiz olarak görüntülüyorsunuz, geliyorsunuz ve komşunuzun sizin arkanızdan çevirdiği dedikoduları dinleyebiliyorsunuz.
Yazi ve animasyonlar: Bilgecan Dede
Doga Kurkcuoglu
Yazar: Doga Kurkcuoglu (tümünü gör)
- Fourier Serisi yazısına ek: - 23 Aralık 2018
- Yapay zekâ yüzünden kaybolacak ve eklenecek iş sayıları, bir tabloda - 4 Nisan 2018
- 130 yıl sonra gelen adalet: Telefonun mucidi resmî olarak Antonio Meucci! - 18 Şubat 2018
- Denklem Yazmak - 6 Ocak 2018
- Temel Harmonikler ve Lissajous Eğrileri - 17 Aralık 2017

Harika anlatım. Özellikle animasyonları bu denli anlatımı tamamlayıcı şekilde kullanmanız takdire şayan. Bilimle kalın.
Teşekkürler, hep beraber bilimle ilerleyelim! 🙂
SmarterEveryDay’den geliyorum. Guzel yazi olmus. Tebrikler 🙂
Teşekkürler 🙂
Thank you! Smarter everyday
Thanks Destin!
Smarter every day !!
Web sayfanizi SmarterEveryDay youtube kanalinda izledigim videodan buldum.
Müthis bir anlatim sekli. Tebrikler.
Teşekkür ederiz. 🙂
Well done kardeş
Nice explanation
Hey Doga,
I saw your video with Destin at smarter every day.I wanted to let you know that although I was familiar with the concept, the way you drew the logo blew my mind. It was simply amazing! can you tell me how did you get the frequency function from the image. I am a Phd student and am working on a similar problem. I wanted to know how can one get the frequency component from just an image. It would really great if you could help me out on this. Who knows, if something great comes out of it, you could alos benefit from it!
Thanks man.
I am also wondering how it is? Doga, did you find it with the help a bunch of computer algorithm or is there a mathmatical concept that you followed? Thank you.
No, I did not use any algorithms, I implemented the theory I explained above.
Hello Febin,
Thank you for reaching out! Frequency function… Frequency “function” is just integers. They are the harmonics, where the \omega, goes by integer numbers, as in 2 \pi n, where n = 1,2,3, etc. Finding the histogram is the punchline of this problem. You need to find the amplitude for a given frequency. I did that by numerically interpolating the image, then applied Fourier transform to the image for each frequency mode.
I hope this makes sense. Do not hesitate to ask if you have other questions.
Best wishes
Hey,
I work with sound and sentific parts of it. You asked how to get the freq from the image? Maybe one solution is to convert image to MIDI data (like I do in general) and than you can get some interesting data.
At the moment I am working with a device, which converts a pulse and el. current created of beings (humans, animals and plants) which converted to MIDI format, which can be used later for many various purposes.
Nice! Saw this at SmarterEveryDay! Congratulations.
Thank you. You can read our article in English from https://bilimneguzellan.net/purrier-series-meow-and-making-images-speak/
Great Mathmatica Gif models! Thank you for putting the work in and sharing it with the world.
Thank you for your encouraging comment. 🙂
Here’s the English version of the article :
https://bilimneguzellan.net/purrier-series-meow-and-making-images-speak/
Youtube’da denk gelmek supriz oldu gercekten. Tebrikler. Meraklisi icin ilgili videonun baglantisi asagidaki gibi.
https://www.youtube.com/watch?v=ds0cmAV-Yek
Smarter EveryDay’den geldim, it’s really amazing work you did.
Pingback:What is a Fourier Series? (Explained by drawing circles) - Smarter Every Day 205 - TeachersConnect
You can refer to the English Article.
https://bilimneguzellan.net/purrier-series-meow-and-making-images-speak/
Destin is wrong, you pronounced GIF correctly.
It might be pronounced with J as JIF in the US but in the UK and everywhere else in the world it’s GIF.
http://howtoreallypronouncegif.com/
🙂
In 2013, Steve Wilhite, the creator of GIF format, told the world that GIF is pronounced with a “J”. Just as we’re to respect the pronunciation of words and names from other languages and cultures, should we not respect the creator’s desired pronunciation?
https://time.com/5791028/how-to-pronounce-gif/#:~:text=Wilhite%20receives%20a%20Lifetime%20Achievement,told%20The%20New%20York%20Times.
BTW–excellent job doing Destin’s Smarter Every Day logo!
we respect native pronounciation of words of other languages when they are rarely used by us. when we use them frequently, we pronounce them our way or translate them or name that things our way. for example, moscow – moskva, english channel – la manche.
Tebrikler hocam. Sayende Fourier’ i anlatmak daha kolay.
Merhaba;
Forier serileri ile ilgili 1-2 çalışmam var (mathematica), daha doğrusu sayı teorisi ile ilgili çalışmalar fakat elde ettiğim sonuçları yorumlayamıyorum. Mail adresini yollarsan sana wolfram notebookları yollayabilirim. Yardımcı olabilirsen çok sevinirim.
Bu arada harika çalışma, ellerine sağlık ve tabii ki bundan sonrası için de başarılar dilerim…
Pingback:Explaining Fourier Again – MasMaz
Pingback:Explaining Fourier Again - itmix.cz | Informační Náskok
Pingback:Explaining Fourier Again
AWESOME
Hey Doga, I was inspired by this so I made a simple Unity app that is a synthesizer / visualizer where you can add and edit the harmonics. http://oscillating-arm.surge.sh/
Play the keys A – L and you will see and hear the corresponding sound.
I have the code here: https://github.com/Andy-Roger/FourierTransformVisualizer
Square Wave example: https://www.youtube.com/watch?v=GaO0smLouGk
Random Harmoics: https://www.youtube.com/watch?v=GGEMOHlcVok
Andy thank u very much for the share ♥
Youtube’dan geldim ben de. Harika bir anlatım olmuş. Bu siteyi de düzenli olarak takip edeceğim artık çünkü gerçekten harika bir site oluşturmuşsunuz.
Buna seara. Va scriu din Bucuresti si va felicit pentru modul in care ati ilustrat grafic seriile furie.
Personal am vazut postarea de pe YouTube care a culminat cu reproducerea logoului realizatorului.
Si acum intrebarile mele:
– toata logica se desfasoara in 2D, XoY functie de timp. Pentru formele simple de unda: sinus, triunghi, dreptunghi totul se rezuma la o formula matematica. Ideal ar fi ca aceasta sa poata fi extrasa din grafica simpla. Practic are fi foarte frumos de inteles cum o formula matematica duce la rezultatul formei de unda.
– provocare: daca ati folosi ca sistem de referinta in analiza axele XoYoZ 3D?. Pentru forma simpla maximum, Ecuatoriala. Posibilitatile de dezvoltare sunt extrem de variate. Practic prin vectorizare a unui model si reversed engineering’s veti obtine o formula matematica a acelui model. Daca se executa si un model ideal de analiza si se descompune si acesta pana la formula sa matematica , comparatia celor doua formula matematica vor arata diferentele dintre modelul ideal si cel vectorizat.
Pingback:Purrier Series (Meow) and Making Images Speak – Science is Awesome
Tebrikler hocam gurur duydum.
https://www.youtube.com/watch?v=ds0cmAV-Yek
Ben de buradan Youtube’a gittim 🙂
Merak ettiğim; acaba gelişmekte olan bir çiçeğin doğal hareketlerini time lapse ile çekim yapıp nasıl bir ses çıkarddığını duybilir miyiz?
Hilmi çiçeğin sesini falan duyamazsın, ortamdaki sesin yarattığı titreşimin görsel okuması o.
what’s the logic of ‘drawing periodic function using circles’? or can you tell me the software you are using?
Pingback:This Video Elegantly Breaks Down the Fourier Series Using Circles – Simitru News
Pingback:This Video Elegantly Breaks Down the Fourier Sequence Utilizing Circles
Pingback:This Video Elegantly Breaks Down the Fourier Sequence Utilizing Circles
I went to this site by typing in EXACTLY what the site was on SmarterEveryDay’s video and I learned a lot. This is amazing so don’t just skip through this site actually read it.
Pingback:What is a Fourier Series? (Explained by drawing circles) – Smarter Every Day 205 | Education Postal 360
Pingback:What is a Fourier Series? (Explained by drawing circles) – Smarter Every Day 205 – Hodoo Daily
Hello,
awesome article, thank you, really inspirational!
However I have still some doubts about how general this method is. I mean, if in the general case do exist epicycles that can reproduce an arbitrary f(x) in the interval [-pi,pi].
In fact you showed only series with sinus function. Each coefficient is the radius of one circle, R. Each term R*sin(…) is the projection of the radius on the vertical axis. With only sinus you can replicate only odd functions.
What happen for function of even parity? Perhaps you can simply switch the X with Y and vice versa. But if the function f(x) is periodic with no definite parity, your Fourier series contains both sinus and cosinus terms. How you can arrange the epicycles to replicate the function? You need the vertical projection and the horizontal as well and not only one.
I am afraid the previous approach works only with f(x) even or odd, but not with both.
Thanks,
Luigi
Where can I get the code for this animations?
Pingback:▶️ What is a Fourier Series? (Explained by drawing circles) - Smarter Every Day 205
Thank you from Argentina!!!
Hey awesome stuff to understand the concept. Thanks a lot. I was wondering if I could myself use this as a tool for visualization to understand things at an intuitive level.
Can you help me with the resources any kind of code base I need to learn to make this myself.